
Figures & data
Figure 1. In vitro activity of Marchantia polymorpha phytochelatin synthase (MpPCS) upon activation with (A) 100, 200, and 300 µM Zn2+ or (B) 100, 200, and 300 µM Cu2+ or (C) 100, 200, 300, 600, and 800 µM Fe2+ for 60 min at 35 °C in the proper reaction mixture (see M&M). (D) Comparison of the in vitro MpPCS activity toward the three metals supplied at the highest concentrations, plus Cd2+ as a reference. PCS activity is expressed in nmol PCn mg−1 MpPCS min−1. Values are mean ± SE, n = 5 (one-way ANOVA, followed by Tukey’s post-hoc test). Different letters indicate significant differences at p < 0.05 for the same thiol-peptide.
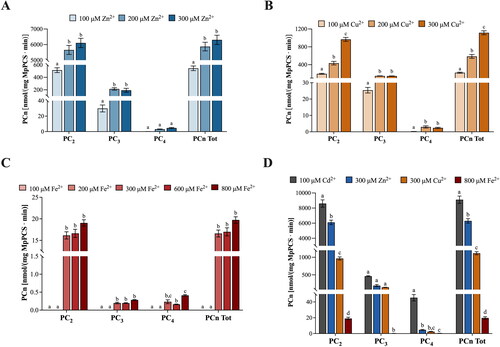
Figure 2. (A) In vivo concentrations of phytochelatins (PCn, nmol g−1 FW) in Marchantia polymorpha gametophytes exposed for 6, 14, 24, 72, and 120 h to 80 μM (light blue bars) or 200 μM (blue bars) Zn. (B) Relative expression levels of M. polymorpha phytochelatin synthase (MpPCS) gene in gametophytes exposed for 6, 14, 24, 72, and 120 h to 80 μM (light blue bars) or 200 μM (blue bars) Zn. Values are means ± SE (n = 3). Different letters indicate significant differences (two-way ANOVA followed by Tukey’s test, p < 0.05).
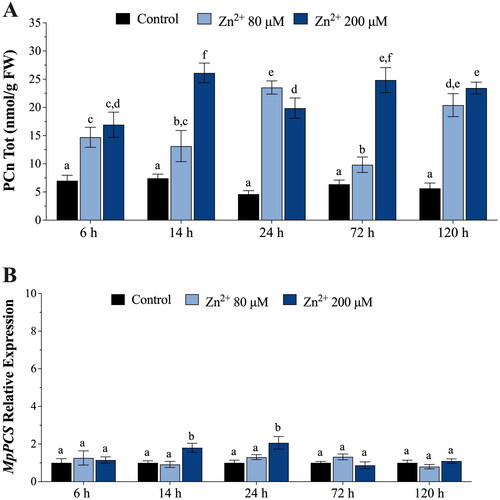
Figure 3. (A) In vivo concentrations of phytochelatins (PCn, nmol g−1 FW) in Marchantia polymorpha gametophytes exposed for 6, 14, 24, 72, and 120 h to 80 μM (beige bars) or 200 μM (orange bars) Cu. (B) Relative expression levels of M. polymorpha phytochelatin synthase (MpPCS) gene in gametophytes exposed for 6, 14, 24, 72, and 120 h to 80 μM (beige bars) or 200 μM (orange bars) Cu. Values are means ± SE (n = 3). Different letters indicate significant differences (two-way ANOVA followed by Tukey’s test, p < 0.05).
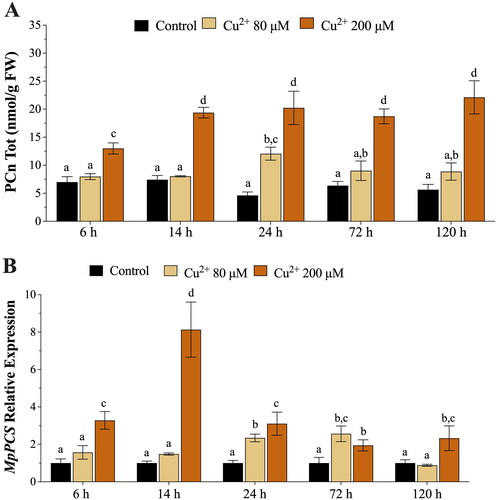
Figure 4. (A) In vivo concentrations of phytochelatins (PCn, nmol g−1 FW) in Marchantia polymorpha gametophytes exposed for 6, 14, 24, 72, and 120 h to 200 μM (pink bars) or 300 μM (amaranth bars) Fe. (B) Relative expression levels of M. polymorpha phytochelatin synthase (MpPCS) gene in gametophytes exposed for 6, 14, 24, 72, and 120 h to 200 μM (pink bars) or 300 μM (amaranth bars) Fe. Values are means ± SE (n = 3). Different letters indicate significant differences (two-way ANOVA followed by Tukey’s test, p < 0.05).
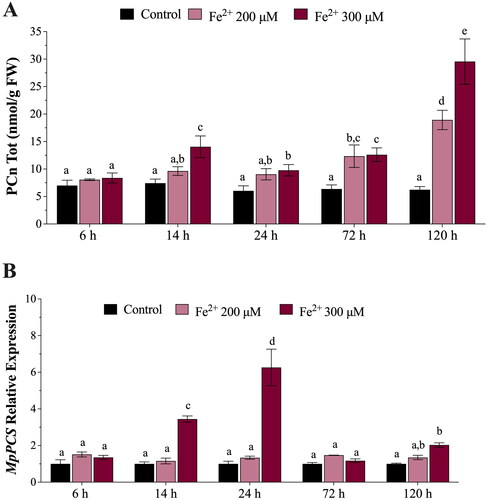
Figure 5. Extracellular concentrations of phytochelatins (PCn, nmol g−1 FW) in the MS ½ growth medium, where Marchantia polymorpha gametophytes were exposed for 24 and 72 h to 80 μM (light blue bars) or 200 μM (blue bars) Zn (A); 80 μM (beige bars) or 200 μM (orange bars) Cu (C); 200 μM (pink bars) or 300 μM (amaranth bars) Fe (E). Extracellular concentrations of GSH (nmol g−1 FW) in the MS ½ growth medium, where M. polymorpha gametophytes were exposed for 24 and 72 h to 80 μM (light blue bars) or 200 μM (blue bars) Zn (B); 80 μM (beige bars) or 200 μM (orange bars) Cu (D); 200 μM (pink bars) or 300 μM (amaranth bars) Fe (F). Values are means ± SE (n = 3). Different letters indicate significant differences (two-way ANOVA followed by Tukey’s test, p < 0.05).
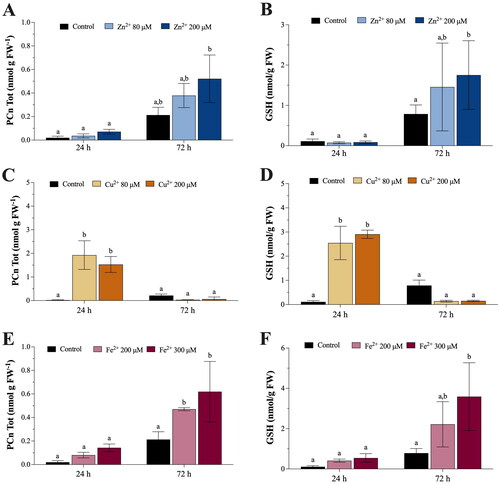
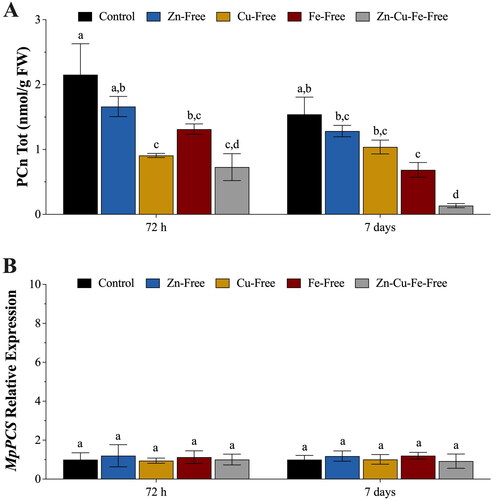
Figure 6. (A) In vivo concentrations of phytochelatins (PCn, nmol g−1 FW) in Marchantia polymorpha gametophytes subjected for 72 h and 7 days to Zn starvation (blue bars), Cu starvation (yellow bars), Fe starvation (amaranth bars) and Zn-Cu-Fe starvation (grey bars), compared with controls (physiological supply of Zn, Cu, and Fe). (B) Relative expression levels of the M. polymorpha phytochelatin synthase (MpPCS) gene in gametophytes exposed for 72 h and 7 days to Zn starvation (blue bars), Cu starvation (yellow bars), Fe starvation (amaranth bars) and Zn-Cu-Fe starvation (grey bars), compared with controls (physiological supply of Zn, Cu, and Fe). Values are means ± SE (n = 3). Different letters indicate significant differences (two-way ANOVA followed by Tukey’s test, p < 0.05).