Figures & data
Figure 1. Location of the study area in the Rivière Boniface and Lac Bush regions, subarctic Québec
Figure 2. Time periods covered by the growth ring chronologies developed in the Rivière Boniface region according to the type of environment (LWC: Lichen Woodland Chronology; WkC: Wetland krummholz Chronology; WtC: Wetland tree Chronology). (A) Payette et al. (Citation1985); (B) Payette et al. (Citation1989); (C) Vallée and Payette (Citation2004); (D) Lavoie and Payette (Citation1997); (E) Arseneault and Payette (Citation1997a); (F) Pond 1 (P1), Pond 2 (P2), Lac Bon (LB), Lac à l’eau (LE): Payette and Delwaide (Citation2004); (G) Cyr and Payette (Citation2010); (H) Asselin and Payette (Citation2006). Solid lines correspond to dated growth ring chronologies and dashed lines to floating chronologies. Juxtaposing the two lines (solid and dashed) shows that these chronologies were first published as floating, then dated for the present study
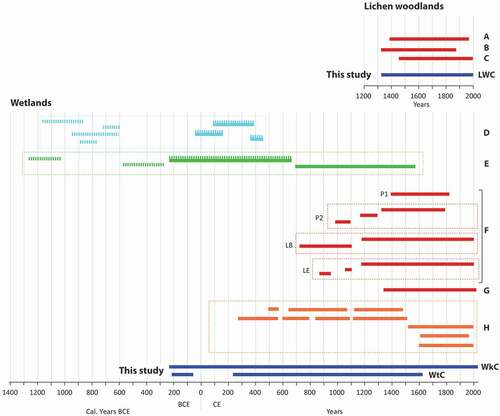
Figure 3. Photographs from the Rivière Boniface area: (a, b) black spruce-lichen woodland with living erect trees developed during the 20th century and dead sub-arborescent trees-krummholz (in the foreground) that lived during the Little Ice Age; (c) wetland spruce environment; (d) stunted spruce that lived during the Little Ice Age; (e) erect spruce trees that lived during the 16th century in contrast with living krummholz in a permafrost peatland; (f) stunted spruce clones with thufurs of Rhododendron subarcticum. Photo credit: S. Payette
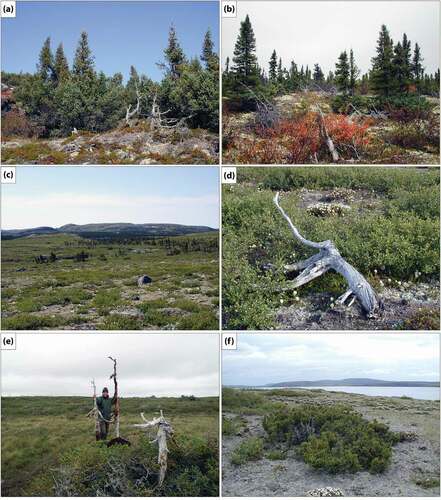
Figure 4. Frequency of light ring years per century in the Rivière Boniface area. The number of samples is indicated at the top of each bar. Different shades of blue indicate the percentage of samples for a given century on which a given number of light ring years were observed
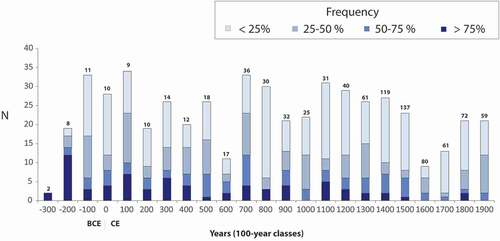
Table 1. Characteristics of the WkC, WtC and LWC chronologies
Figure 5. Mean ring width of black spruce individuals from the Rivière Boniface area according to cambial age, along with the corresponding 32-year cubic spline and number of measured stems. (a) Erect trees (WtC) and (b) krummholz individuals (WkC)
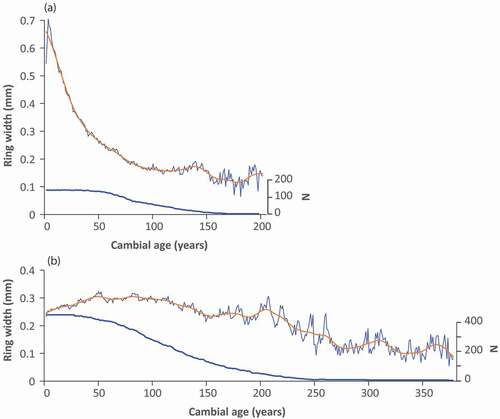
Figure 6. (a) Lifespan of sampled black spruce from the wetland environment of the Rivière Boniface area (WkC and WtC); (b) proportion of erect stems (in red) and krummholz (in black) based on the corresponding century of the first year of the lifespan. The number of samples per century is indicated above each bar
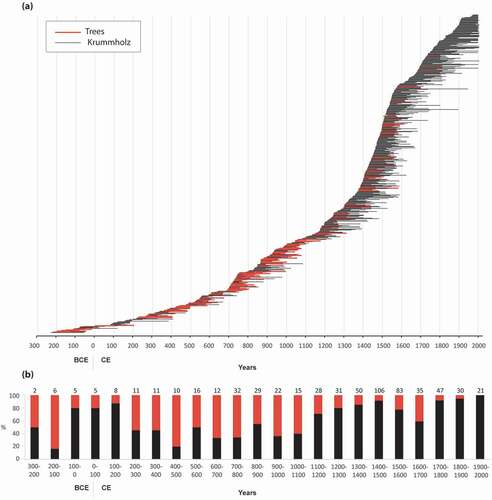
Figure 7. Mean, minimum and maximum number of growth rings per century, for all spruce individuals sampled in wetlands of the Rivière Boniface area, either trees (WtC; blue) or krummholz (WkC; orange). Values are recorded according to the corresponding century of establishment. The number of samples established during each century is indicated above each bar. Dots indicate that only one stem established during the corresponding century
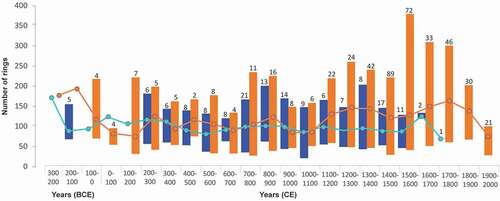
Figure 8. (a) Mean ring width of krummholz from wetland sites (WkC) of the Rivière Boniface area, along with a superimposed 32-year cubic spline; (b) number of stems used in the chronology; (c) EPS (Expressed Population Signal) calculated according to period
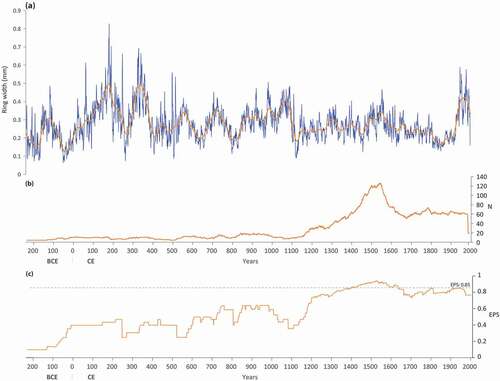
Table 2. Statistics of the floating chronologies
Figure 9. Mean ring width of spruce trees and krummholz that have lived during each century in wetlands (WkC and WtC: blue) and lichen woodlands (LWC: yellow) of the Rivière Boniface area. The corresponding number of samples is indicated at the top of each bar. Because floating chronologies (red) were 14C dated, mean width and number of samples refer to the entire length of each chronology
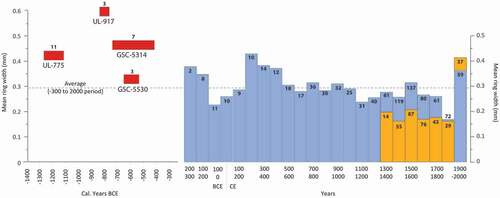
Figure 10. (a) Mean standardized chronology of erect stems from wetland sites of the Rivière Boniface area (WtC), covering the 216 BCE-1619 CE period (except between 50 BCE and 225 CE for which less than five spruce individuals were available); (b) number of individuals included in the chronology; (c) EPS (Expressed Population Signal) calculated according to period
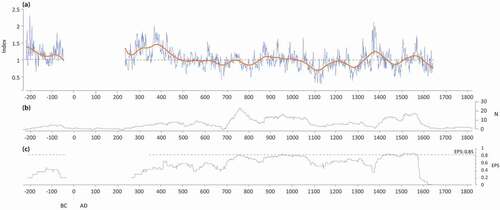
Figure 11. (a) Lichen woodland chronology (LWC) from the Rivière Boniface area, along with a superimposed 32-year cubic spline; (b) annual number of stems used in the mean chronology; (c) EPS (Expressed Population Signal) calculated according to period
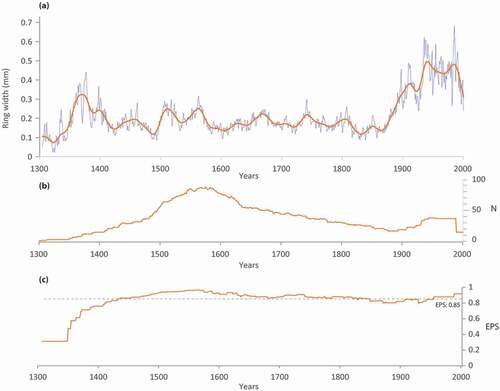
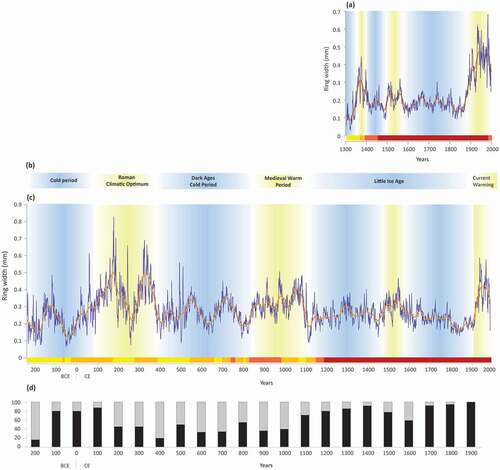
Table 3. Statistics of the LWC and WkC chronologies. Chronologies were indexed using a 32-year cubic spline
Figure 12. (a) Mean ring width chronologies in lichen woodland (LWC) and wetland environments (WkC) of the Rivière Boniface area over the 1304–2000 CE period; (b) annual ring width difference between the two chronologies according to four periods (b1: 1304–1630; b2: 1630–1840; b3: 1840–1880; b4: 1880–1940); (c) mean standardized (32-year cubic spline) chronologies and annual number of samples
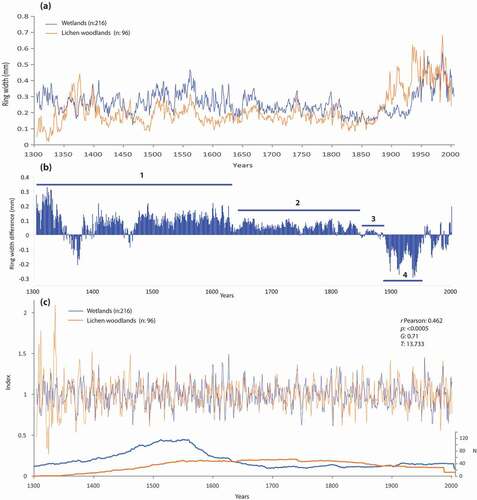
Figure 13. (a) Response coefficients between mean monthly temperature and LWC indexed (32-year cubic spline) chronology (in orange) and the indexed (32-year cubic spline) WkC chronology (in blue); (b) response coefficients between total monthly precipitation data and both chronologies. Stars represent significant correlations at the p < 0.05 confidence level (response coefficient: 0.41 and 0.35, respectively)
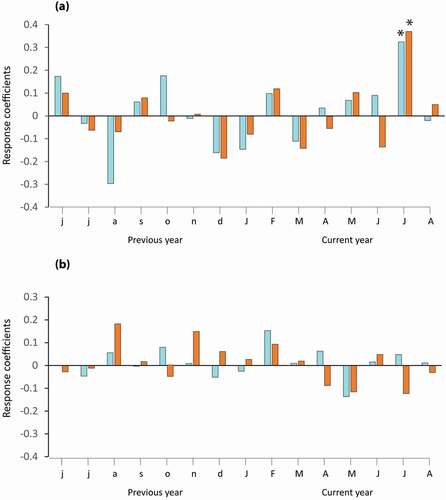
Figure 14. (a) Lichen woodland chronology (LWC), along with a superimposed 32-year cubic spline. Horizontal bar indicates number of stems included in the chronology (yellow: 1–5; orange: 6–10; light red: 11–20; dark red: >20); (b) well-documented climatic periods; (c) wetland krummholz chronology (WkC), superimposed with a 128-year cubic spline. Horizontal bar indicates number of stems (same classes as LWC); (d) proportion of erect stems (grey bars) and krummholz (black bars) by 100-y periods. Periods of increased growth are highlighted as yellow zones, and periods of reduced growth as blue zones