
Figures & data
Figure 1. Number of inventors by countries in US Patents.
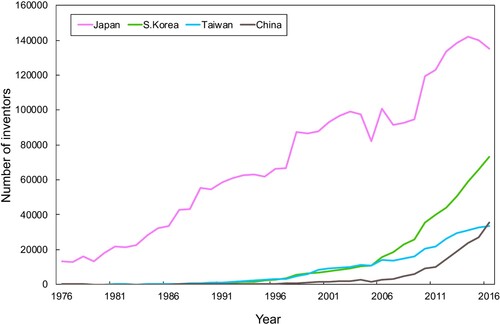
Table 1. Database of co-invention network.
Figure 2. Network dynamics of East Asia.
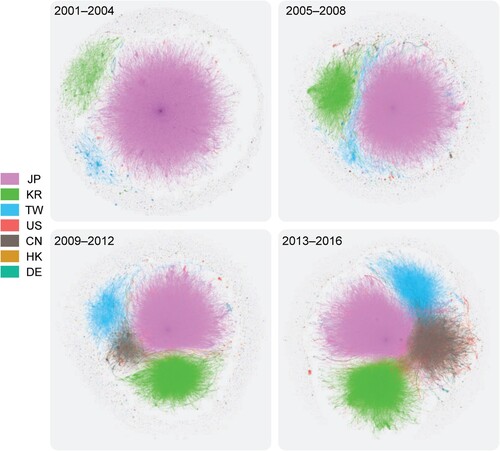
Table 2. Fitted power law distribution.
Figure 3. Power node distribution by country.
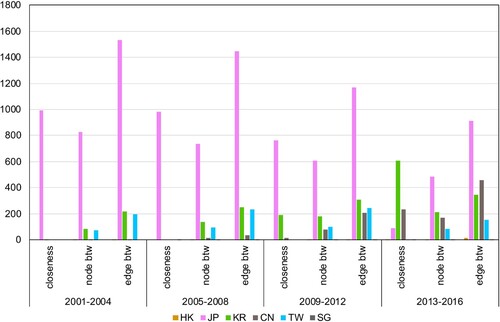
Table 3. Centrality of each time period.
Figure 4. Structural power nodes plot.
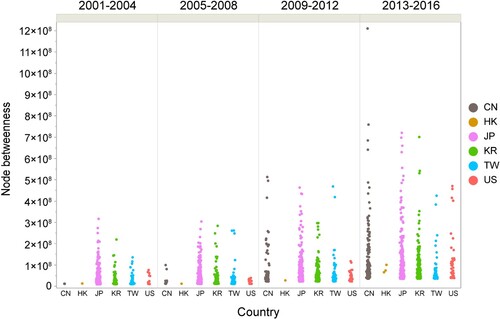
Figure 5. Average HHI for each period.
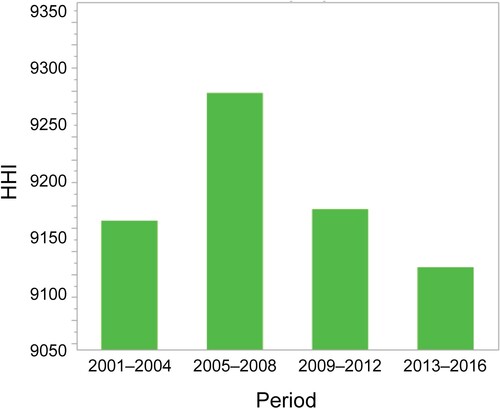
Figure 6. Bubble chart by group size for each period.
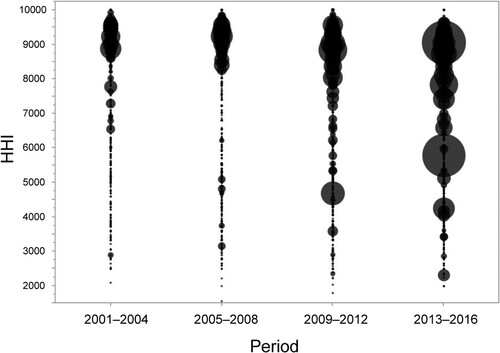
Table 4. List of metropolitan areas and populations.
Figure 7. Heat map of GIN among major cities (regions).
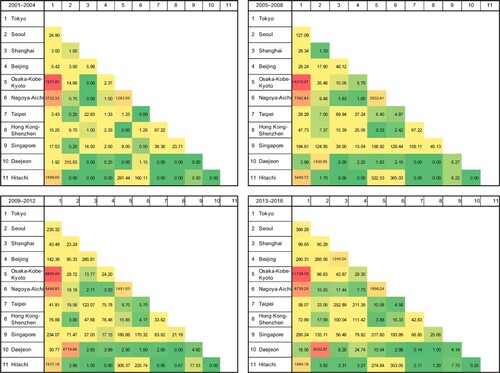
Figure 8. Map of network in the metropolitan areas of East Asia.
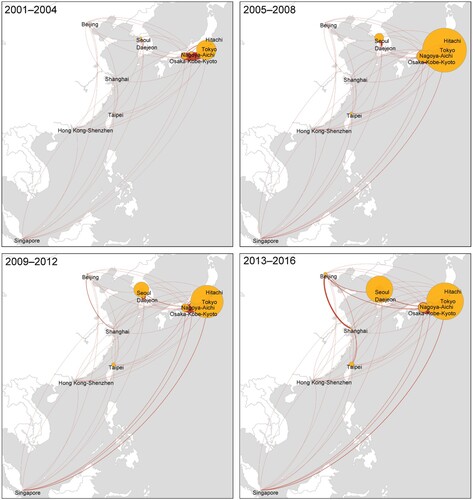
Table 5. Overview of determinants.
Table 6. Results of Negative binomial regression.
Table 7. Results of QAP.