
Figures & data
Figure 1. Phylogenetic placement of yeasts under study based on partial LSU-rRNA gene sequences. The tree was reconstructed using the maximum-likelihood analysis of 647 aligned positions with the Tamura–Nei model. The scale bar indicates the number of expected substitutions per site. The numbers provided on branches are frequencies with which a given branch appeared in 1000 bootstrap replications. The tree was rooted with Rhizopus oryzae.
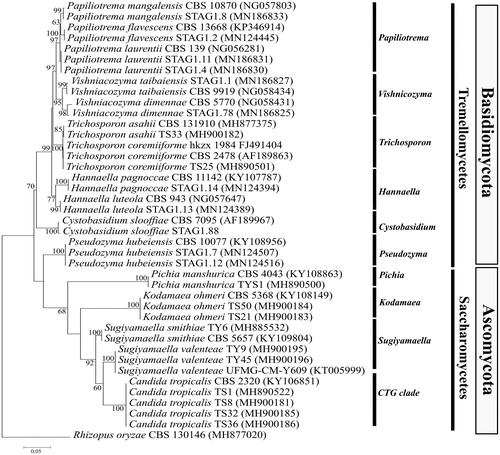
Table 1. Summary of yeasts obtained in this study and their biochemical profile.
Table 2. Ethanol and xylanase production profiles of yeasts.
Figure 2. Effect of temperature, pH, and sugar concentration on ethanol production. (A) Ethanol production (in g/L) by TS32 and standard strain NCIM3186 tested at different temperatures; 20, 25, 30, 35, 37, and 40 °C. (B) Ethanol production (in g/L) at 35°C and different pH tested; 4.0, 4.5, 5.0, 5.5, and 6.0. (C) Ethanol production (in g/L) at 35 °C, pH 4.5 and varying glucose concentrations; 5%, 10%, 15%, 20%, and 30%. Asterisks (*) symbol denotes the level of significance with a p value <0.05 analyzed by one-way ANOVA.
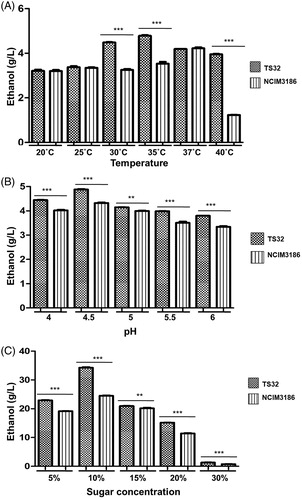
Table 3. Ethanol production from alkali-pretreated rice straw hydrolysate.