
Figures & data
Figure 1. Geographical location and segregation of each sampling site. (A) Geographical location of the Ulleungdo and Dokdo Islands. The two volcanic islands are ecologically segregated from mainland and each other. (B) Site 1: Dongdo island of the Dokdo Islands. (C) Ulleungdo Islands; (C1) Site 2: Sadong, slope cliff near the seashore, (C2) Site 3: Primitive virgin forest in Taeha in the Ulleungdo Islands. The sampling sites are circled. The map images were downloaded from the Cultural Heritage Administration of Korea (CHA) Portal Site (http://www.heritage.go.kr/heri/idx/index.do., accessed on 21 October 2020) and modified for this study.
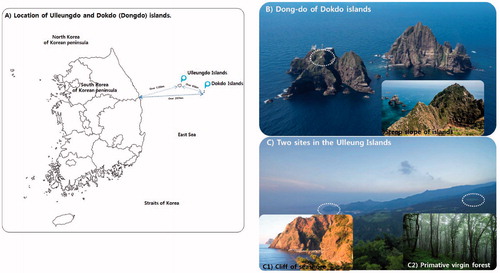
Figure 2. Rarefaction curves for operational taxonomic units (OTUs) from each site. OTUs were clustered at 3% dissimilarity using CD-HIT. The microbial community in the rhizoplane and the rhizosphere of Dongdo, Dokdo Islands (OTUs, 140/341; sequencing reads, 84,267/94,745), Sadong, Ulleungdo Islands (OTUs, 154/389; sequencing reads, 95,395/117,939), and Taeha (OTUs, 212/478; sequencing reads, 86,299/89,864) are shown.
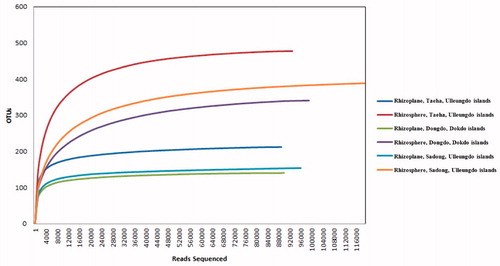
Table 1. Geographical information regarding the commonly identified halophyte species, Sedum takesimense, from the islands of the Korean peninsula.
Table 2. Pyrosequencing data and statistical analyses.
Table 3. Soil analysis results per geographical site.
Figure 3. Fungal diversity variation from rhizoplane to rhizosphere in each island. The Simpson’s Diversity Index quantifies the biodiversity of a habitat, and considers the number of species present, and the abundance of each species. The Shannon’s diversity index (H) accounts for both abundance and evenness of the species.
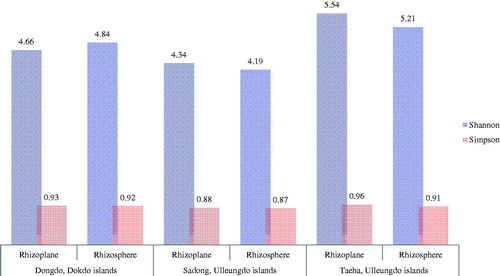
Figure 4. Chao fungal genera richness index variation from rhizoplane to rhizosphere in each island. The Chao1 index is used to estimate the richness (estimated richness; measurement of OTUs expected in samples given all the bacterial species identified in the samples).
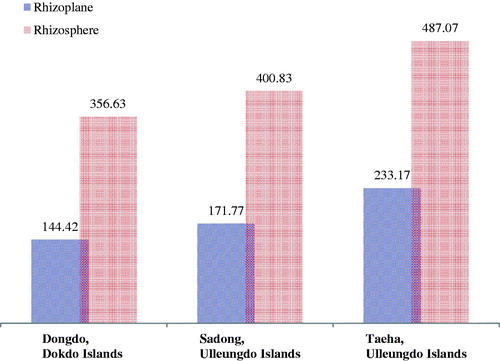
Figure 5. Comparison of the variation in dominant fungal phyla between the rhizosphere and the rhizoplane. Differences are highlighted. The dominance ratio (%) is represented per fungal phyla. Comparing the sites, the rank, and ratio of dominance are similar in the rhizoplane of all sampling sites, but with the rhizosphere areas, more affected by the marine environment, a change in the order of dominance was observed for each sampling point.
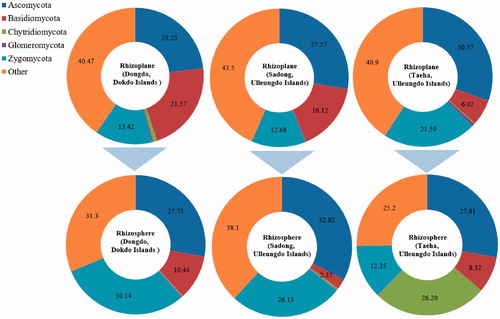
Table 4. Distribution of fungal phyla from the host halophyte soil (unit: %, RS: rhizosphere, RP: rhizoplane).
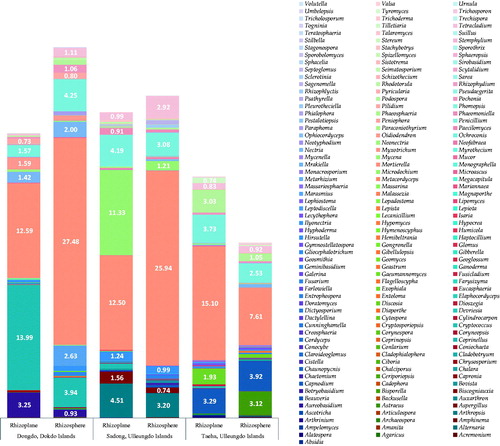
Figure 6. Unique fungal genera distribution in each coastal region. Fungal microbiota structures were different in each of the coastal regions. Only those fungal genera that accounted for 0.7% or more of each community were labeled. The ratio (%, dominance) of each fungal genus.
Supplemental Material
Download MS Word (133.5 KB)Data availability statement
All data are available within the manuscript and its supplementary materials.