
Figures & data
Table 1. Details of sequences used in molecular phylogenetic analyses in this study.
Figure 1. Phylogenetic tree derived from maximum likelihood analysis of combined ITS and nrLSU genes of 40 specimens. Lentinus polychrous and Polyporus thailandensis were set as the outgroup. Numbers above branches are the bootstrap percentages (left) and Bayesian posterior probabilities (right). Bootstrap values > 75% and Bayesian posterior probabilities > 0.90 are shown. The scale bar displays the expected number of nucleotide substitutions per site. Type species are shown in bold. Sequences derived in this study are shown in red.
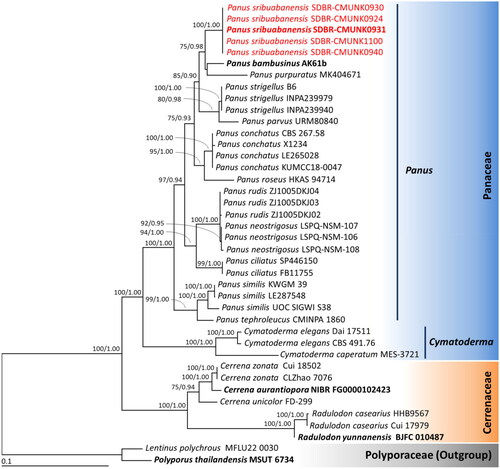
Figure 2. Basidiomata of Panus sribuabanensis SDBR-CMUNK0931 (holotype) (A) and SDBR-CMUNK0940 (B); microscopic features obtained from SDBR-CMUNK0931 (C–H); basidiospores (C); basidia (D); Pleurocystidia (E); cheilocystidia (F), Generative hyphae (G); Skeletal hyphae (H). Scale bars: A, B = 50 mm, C = 5 μm, D–G = 10 μm.
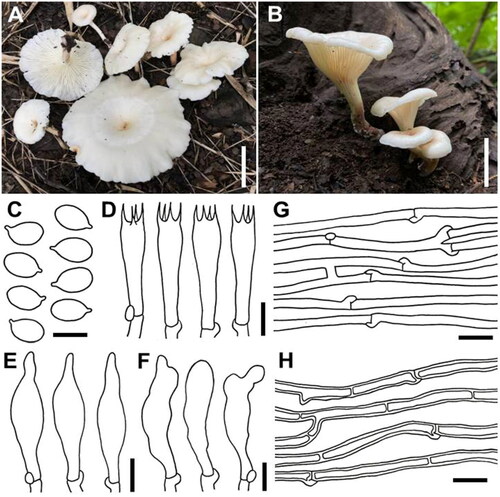
Table 2. Comparison microscopic features and distribution of Panus sribuabanensis with P. bambusinus, P. caespiticola, and P. tephroleucus.
Table 3. Nutritional value on a dry basis of different specimens of Panus sribuabanensis in this study.
Table 4. Total phenolic content and antioxidant activity of sample extracts of Panus sribuabanensis in this study.