Figures & data
Table 1. GenBank accession numbers of sequences used for the phylogenetic analyses in this study.
Table 2. Morphological comparison between Absidia microsporangia sp. nov. (KNUF-22-316AT) and the phylogenetically closest species of Absidia.
Figure 1. Morphology of Absidia microsporangia sp. nov. KNU-22-316T. (A, B) Colonies on PDA and MEA at 25 °C for seven days, obverse and reverse, respectively; (C) swelling on sporangiophores; (D, E) sporangium; (F) columellae, collars, and projections; (G) rhizoid; (H) sporangiophores. Scale bars: C–I = 10 μm. Black arrows, collars; a red arrow, projection.
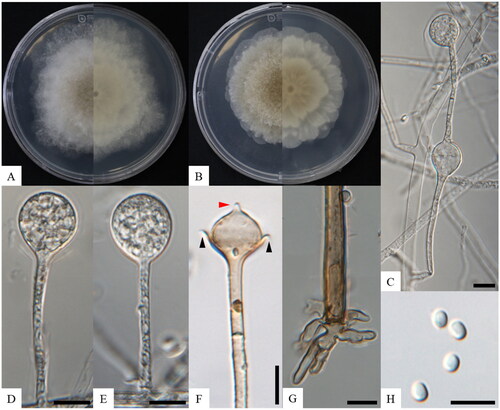
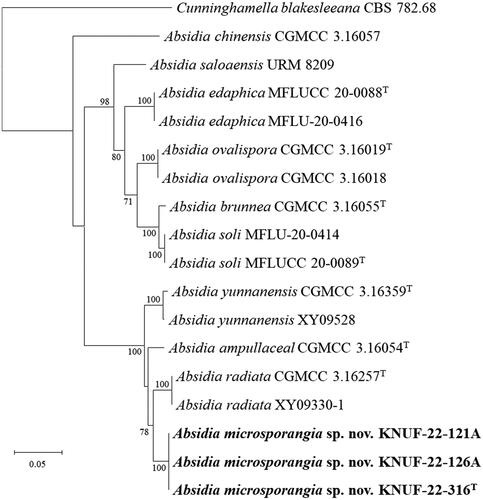
Figure 2. Neighbor-joining phylogenetic tree based on ITS regions and LSU gene sequences showing the phylogenetic position of the three isolated strains among the related strains in the genus Absidia. Cunninghamella elegans CBS 167.53 was used as the outgroup. The strains isolated in this study are indicated in bold, and the numbers above the branches represent the bootstrap values (>70%) obtained for 1000 replicates. Scale bar = 0.02 substitutions per nucleotide position.