Figures & data
Table 1. Coded and non-coded levels of independent variables used in the RSM design.
Table 2. Response values for relative enzyme activity obtained from RSM.
Table 3. Results of the analysis of variance to response surface quadratic model.
Figure 1. Predicted and experimental values for relative enzyme activities (R2 = 0.949).
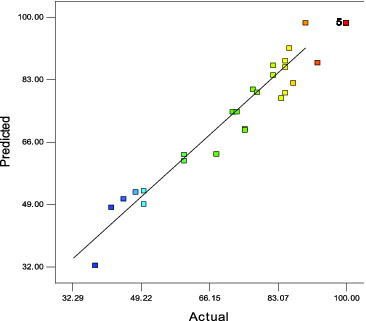
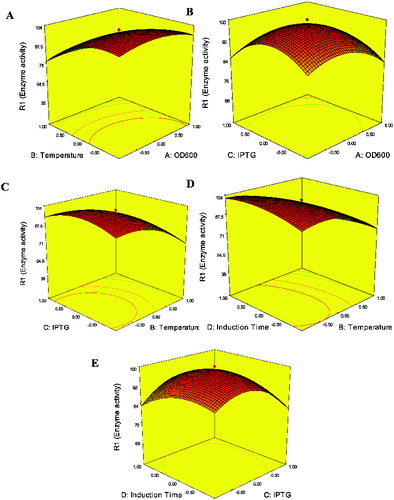
Figure 2. Response surface plots showing the effect of interaction factors on enzyme activity: (A) OD600 and induction temperature (IPTG concentration 1.5 mmol, induction time 20 h); (B) OD600 and IPTG concentration (induction temperature 34 °C, induction time 20 h); (C) IPTG concentration and induction temperature (OD600 0.8, induction time 20 h); (D) induction temperature and induction time (IPTG concentration 1.5 mmol, induction temperature 34 °C); and (E) induction time and IPTG concentration (OD600 0.8, induction temperature 34 °C).