
Figures & data
Table 1. Nucleotide sequences of the primers (5′ → 3′).
Figure 1. Primer design for RealAmp. (A) Nucleotide sequence alignment of the target regions of cytb genes. Arrows indicate the primers used for RealAmp assays. (B) Schematic diagram showing the positions of the RealAmp primers.
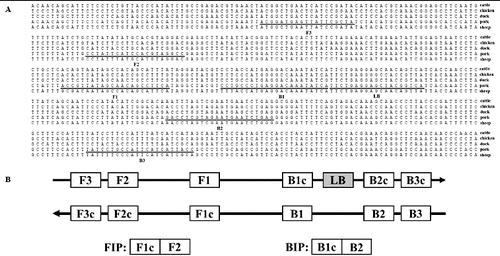
Figure 2. Real-time amplification of the pork cytb gene using the RealAmp assay.
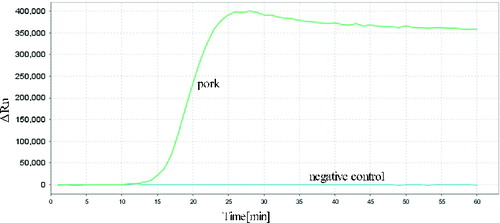
Figure 3. Analysis of pork cytb gene by RealAmp with agarose gel electrophoresis. Lane M, DL500 DNA Marker; lane N, negative control; lane 1, RealAmp products of cytb.
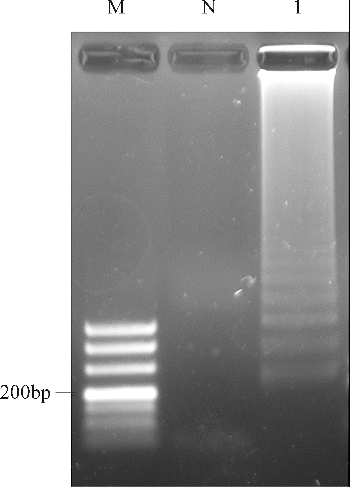
Figure 4. SYBR green I fluorescent dye-mediated monitoring of pork specific RealAmp assay amplification.
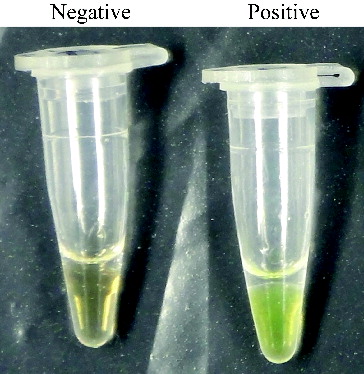
Figure 5. Specificity of RealAmp assays. Sample 1, pork; sample 2, cattle; sample 3, sheep; sample 4, chicken; sample 5, duck; sample 6, negative control.
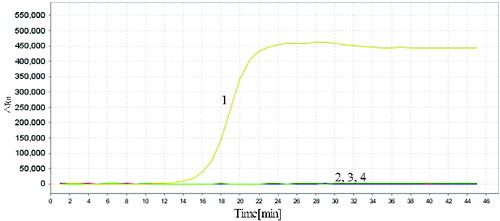
Figure 6. Sensitivities of RealAmp assays performed with serial dilutions of pork DNA (100 ng to 1 pg). (A) Amplification curves of RealAmp detection for pork DNA. (B) Standard curves for RealAmp assays generated from the amplification plots between serial 10-fold dilutions of pork DNA and the time to a positive signal by employing the specific RealAmp assay.
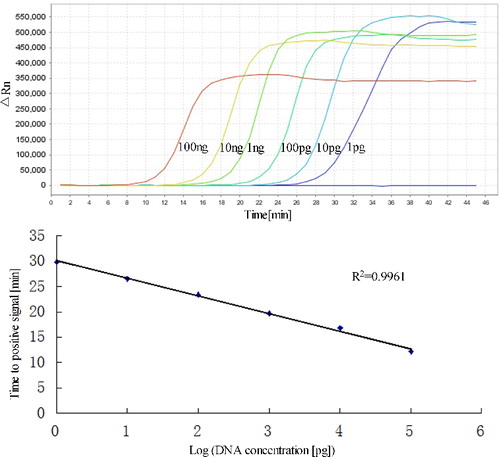
Figure 7. Agarose gel electrophoresis of PCR products targeting the pork cytb gene in different amounts of DNA. Lane M, 100 bp DNA ladder; lane N, negative control; and lanes 1–6, 100 ng, 10 ng, 1 ng, 100 pg, 10 pg, 1 pg pork DNA, respectively.
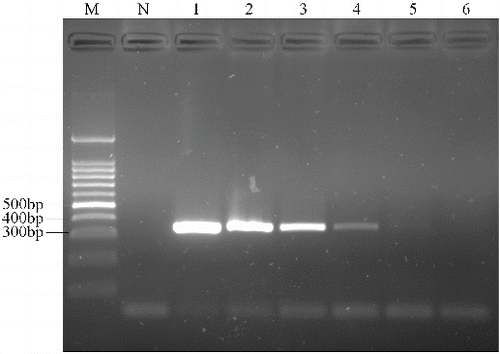
Table 2. Results of RealAmp measurement of heat-treated meat mixtures.