Figures & data
Figure 1. Effects of DHP1A on CCl4-induced liver injury. (A) ALT; (B) AST; (C) LDH; (D) 8-OHdG. ap < 0.05 and bp < 0.01 as compared with the CCl4 treatment group.
Figure 2. Pathological changes of liver tissues in each treatment group. H&E staining of liver section from (A) blank control group; (B) 25 mg/kg silymarin treatment group; (C) 100 mg/kg DHP1A treatment group; (D) 200 mg/kg DHP1A treatment group; (E) CCl4 treatment group; (F) 25 mg/kg silymarin + CCl4 treatment group; (G) 100 mg/kg DHP1A + CCl4 treatment group and (H) 200 mg/kg DHP1A + CCl4 treatment group.
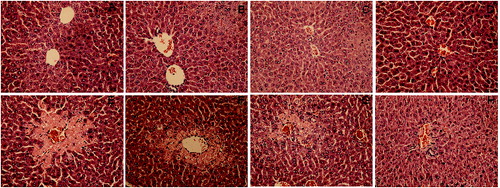
Figure 3. Effects of DHP1A on cytokines expressions. (A) TNF-α; (B) IL-1β; (C) IL-10. ap < 0.05 and bp < 0.01 as compared with the CCl4 treatment group; *p < 0.05 as compared with the blank control group.
Figure 4. Effects of DHP1A on chemokine mRNA expression. Expressive levels of (A) MCP-1 mRNA and (B) MIP-2 mRNA were measured in the livers of different treatment groups. GAPDH was used as internal controls. ap < 0.05 and bp < 0.01 as compared with the CCl4 group; *p < 0.05 as compared with the blank control group.
Figure 5. Immunostaining of CD68 in the liver section. (A) blank control group; (B) 25 mg/kg silymarin treatment group; (C) 100 mg/kg DHP1A treatment group; (D) 200 mg/kg DHP1A treatment group; (E) CCl4 treatment group; (F) 25 mg/kg silymarin + CCl4 treatment group; (G) 100 mg/kg DHP1A + CCl4 treatment group and (H) 200 mg/kg DHP1A + CCl4 treatment group.
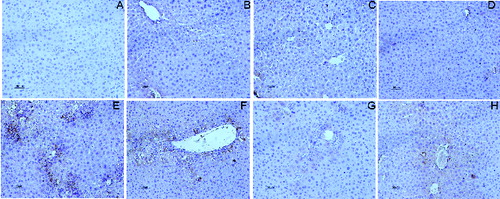
Figure 6. Effects of DHP1A on p-Iκ B expression.