
Figures & data
Figure 1. Fourier transform infrared (FTIR)-absorption spectrum of the biosurfactant produced by P. aeruginosa Lbp5 strain.
Figure 2. Percentage of phenanthrene (PHE) desorbed in the presence of different concentrations of lipopeptide. Data are mean values from three independent experiments. Error bars represent standard error of the means.
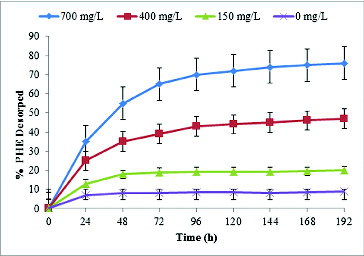
Figure 3. Percentage of pyrene (PYR) desorbed in the presence of different concentrations of lipopeptide. Data are mean values from three independent experiments. Error bars represent standard error of the means.
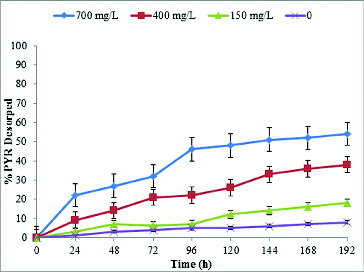
Figure 4. Two-compartment model fits to PHE (A) and PYR (B) desorption kinetics data in the presence of 150 (■), 400 (▴) and 700 mg L−1 (♦) of lipopeptide. Data points are mean values from three independent experiments. Error bars represent standard errors of the means.
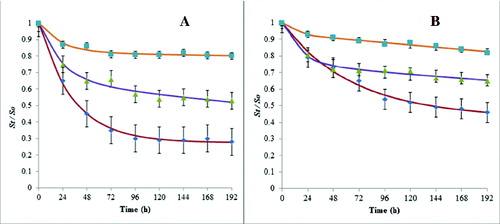
Table 1. Best-fit parameters of the two-compartment model for the different lipopeptide supplementations for each PAH.