Figures & data
Table 1. General classification of bacteriocins.
Figure 1. Global contribution per continent and the most representative countries in bacteriocin studies from 2004 to 2015.
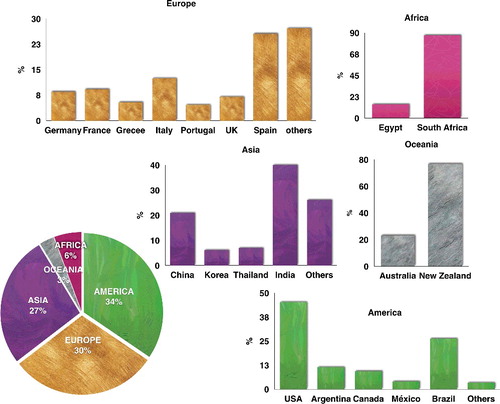
Figure 2. Contribution of published papers (%) concerning bacteriocins in different applications from 2004 to 2015.
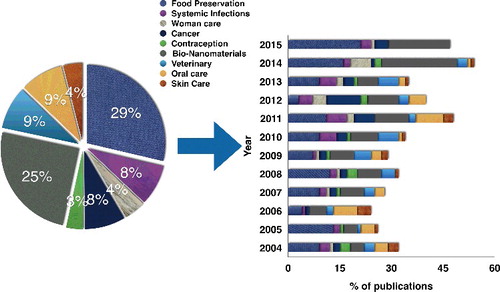
Figure 3. Contributions per continent and the most representative countries in bacteriocin applications from 2004 to 2015.
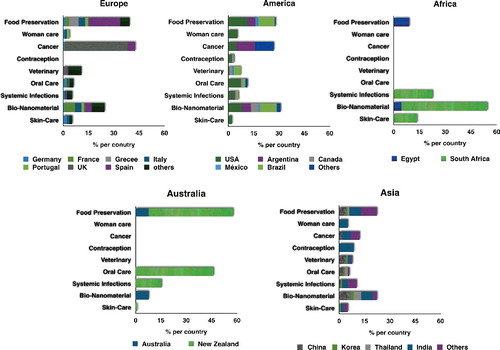
Table 2. Bacteriocins in food and biomedical applications
Table 3. Bacteriocins produced for commercial use.
Figure 4. Countries most representative in granted patents for bacteriocins (2004–2015).
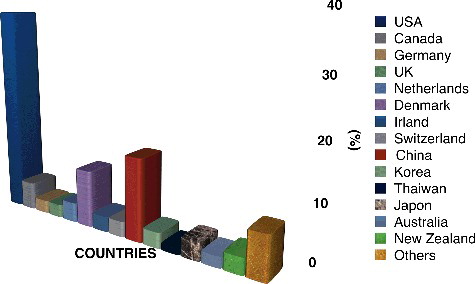
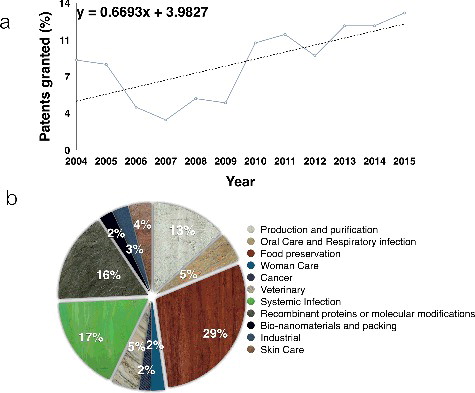
Figure 5. Trend in the growth of granted patents concerning bacteriocins from 2004 to 2015 (a) and distribution among different fields of application (b).