Figures & data
Figure 1. Sequence alignment of several members of the AATase family. (1) AATase from Lb. brevis CGMCC 1306; (2) AATase from Phormidium lapideum; (3) AATase from Thermus thermophilus; (4) AATase from Thermus aquaticus; (5) AATase from Thermotoga maritima; (6) aromatic aminotransferase from Pyrococcus horikoshii; (7) alanine aminotransferase from Pyrococcus furiosus. The deduced amino acid sequence was analysed using the ENDscript 2 program. Alternate residues are highlighted by grey stars. Identical and similar residues are boxed in black and grey, respectively. Solvent accessibility (acc) is rendered by a first bar below the sequence (in dark is accessible, grey is intermediate, white is buried) and hydropathy (hyd) by a second bar below (in dark is hydrophobic, white is neutral, gray is hydrophilic). The alignment of secondary structure was based on the 3D data through structural modelling.
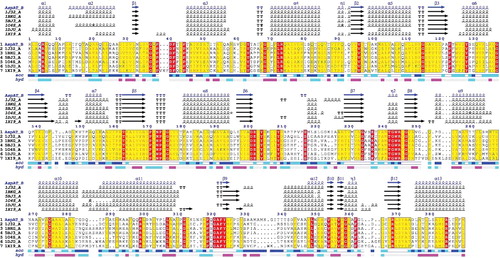
Figure 2. Sodium dodecyl sulphate-polyacrylamide gel electrophoresis (SDS-PAGE) analysis of the expression and purification of recombinant AATase in E. coli BL21. The protein was visualized with Coomassie blue staining. Lanes: (1) cell extracts; (2) flow-through sample after loading on crude extract; (3) sample of 20 mmol/L imidazole elution; (4) sample of 50 mmol/L imidazole elution; (5) sample of 100 mmol/L imidazole elution; (6) sample of 250 mmol/L imidazole elution; (7) low-weight protein marker.
Figure 3. High-performance liquid chromatography (HPLC) analysis of reaction products of purified recombinant AATase with L-Asp as the substrate. Absorption traces of the column eluates are shown. Absorption of the derivatized L-Asp and L-Glu was measured at 254 nm.
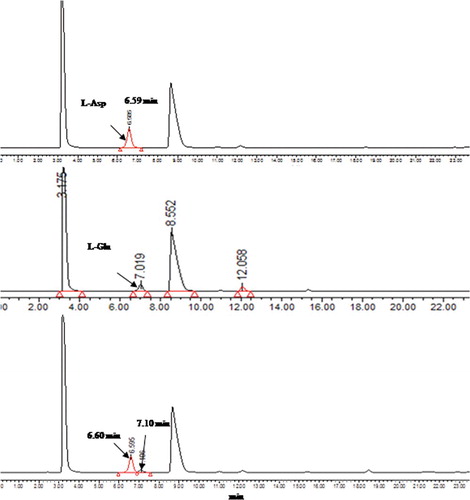
Figure 4. Cartoon representation of the homology model of wild-type AATase monomer from Lb. brevis CGMCC 1306. Lys237, Trp125, Trp190, and Trp244 residues in sticks are marked.
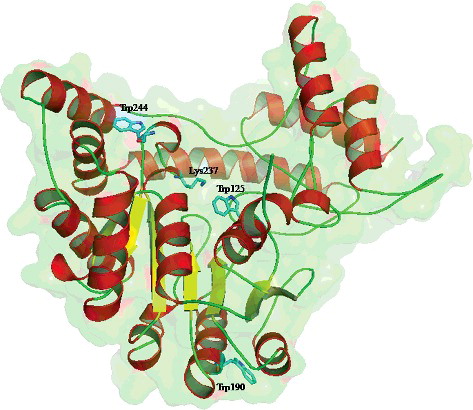
Figure 5. Characterization of the purified AATase. (A) Effects of reaction temperature on the activity of AATase in potassium phosphate buffer (pH 8.0). (B) Thermostability of AATase. The temperature stability of the purified AATase was determined by measuring the remaining activity after incubating the enzyme for various time separately at 40, 45, 50, 55, or 65 °C in the absence of the substrate. (C) Effects of reaction pH on the activity of AATase. Two different buffers including potassium phosphate (solid square) and Tris-HCl (solid circle) were applied. The data represent the mean ± SD of three parallel experiments.
Figure 6. Kinetic parameters for recombinant AATase from Lactobacillus brevis CGMCC 1306. (A) L-Asp; (B) α-ketoglutaric acid. Kinetic parameters were obtained by fitting the data to Michaelis–Menten equation. The data represent the mean ± SD of three parallel experiments.
Figure 7. Unfolding of AATase in GdmCl solutions. (A) Effects of GdmCl concentration on AATase fluorescence maximum emission wavelength, intensity. Protein concentration of AATase was 0.2 mg/mL. Fluorescence was excited at 280 nm and measurements were carried out at 24 °C. (B) Effects of GdmCl concentration on AATase activity.
Figure 8. Phase diagram representing the unfolding of AATase induced by GdmCl. Protein concentration of AATase was 0.2 mg/mL. Fluorescence was excited at 280 nm and measurements were carried out at 24 °C. The values on the curves are the concentrations of GdmCl. Each straight line represents an all or none transition between two conformers of AATase. I320 and I365 represent the fluorescence intensities at emission wavelengths of 320 and 365 nm, respectively.