
Figures & data
Table 1. Actual and coded independent variables in the BBD for the optimization of β-glucosidase activity in batch cultures of T. harzianum.
Table 2. Polynomial equation for the estimated coded and processed factors for β-glucosidase activity used in BBD.
Figure 1. Comparison between the predicted and actual values obtained for the activity of β-glucosidase obtained from the growth culture of T. harzianum.
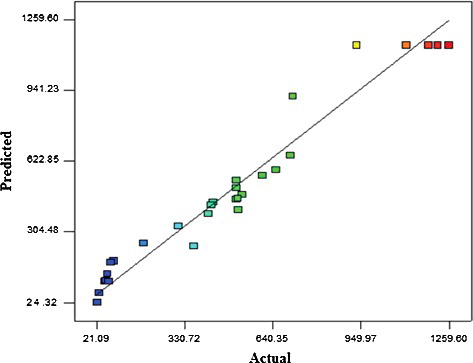
Table 3. Compositions of the various runs of BBD in coded and actual terms for the obtained actual and predicted responses for optimizing β-glucosidase activity in batch cultures of T. harzianum.
Table 4. ANOVA for the second-order polynomial model of BBD.
Table 5. ANOVA for the second order polynomial models and coefficient values for β-glucosidase activity obtained from the growth culture supernatant.
Figure 2. Response surface (a) and contour (b) plots showing the interactive effect of A: temperature and B: carbon source on the activity of β-glucosidase.
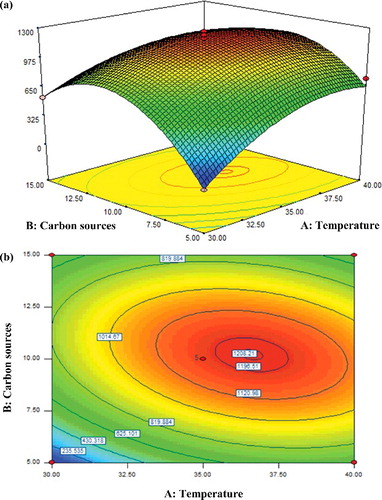
Figure 3. Response surface (a) and contour (b) plots showing the interactive effect of A: temperature and C: inoculum size on the activity of β-glucosidase.
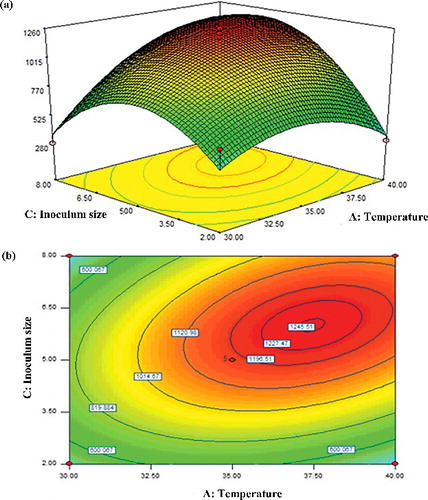
Figure 4. Response surface (a) and contour (b) plots showing the interactive effect of A: temperature and D: pH on the activity of β-glucosidase.
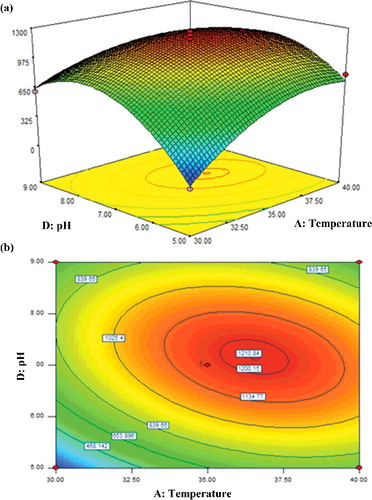
Figure 5. Response surface (a) and contour (b) plots showing the interactive effect of B: carbon sources and D: pH on the activity of β-glucosidase.
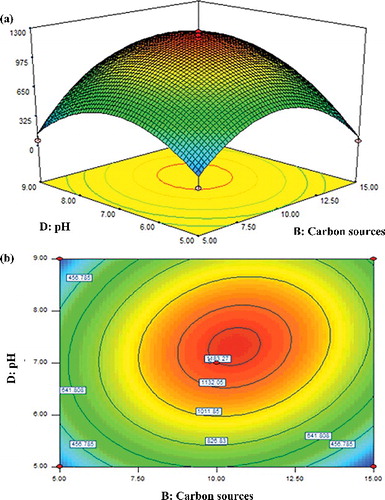
Figure 6. Plate inhibition assay showing the growth of M. phaseolina (denoted by dark areas) inhibited by the β-glucosidase (halo zone) extracted from T. harzianum.
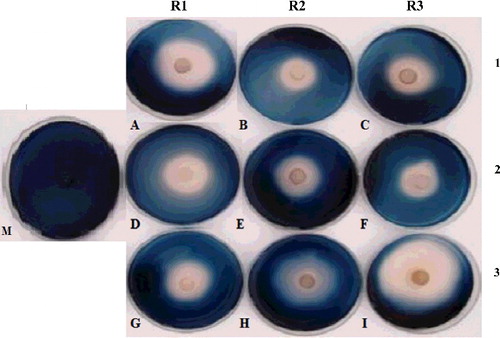
Table 6. Comparison of the predicted and experimental values for β-glucosidase activity obtained from the batch cultures of T. harzianum Rifai.