
Figures & data
Figure 1. Schematic diagram of the membrane-aerated biofilm reactor (MABR).
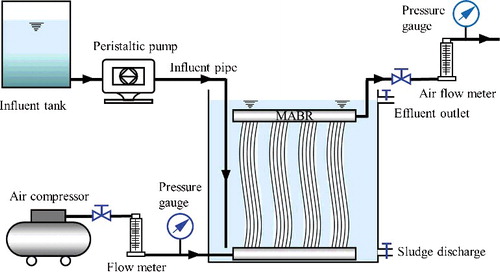
Table 1. Operation conditions during the MABR process study.
Figure 2. DO concentration in the MABR process under different operating conditions.
Figure 3. Effects of intra-membrane air velocity and intra-membrane air pressure on denitrification rate in MABR process.
Figure 4. Variations of TOC, NH4+-N and TN with operation time at different hydraulic loadings. TOC concentration and TOC removal efficiency (a); NH4 +-N and NH4+-N removal efficiency (b); TN and TN removal efficiency (c).
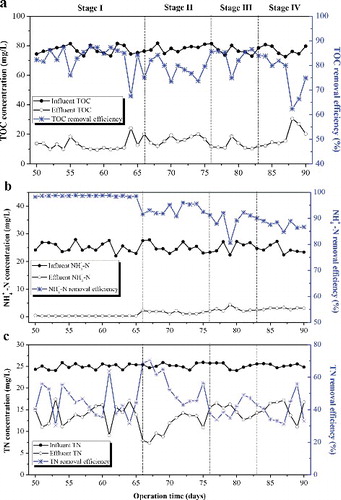
Figure 5. Average N concentration at different hydraulic loading rates and TN removal efficiency.
Figure 6. TOC, NH4+-N and TN removal in MABR system under different influent C/N ratios.
Figure 7. TOC concentration in the influent and effluent and TOC removal efficiency (a) and nitrogen concentration of effluent (b).
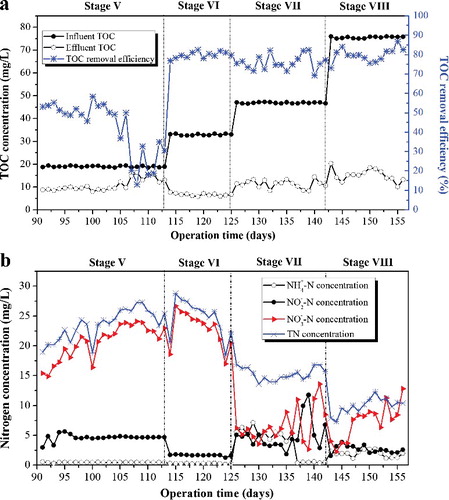
Figure 8. Variations of TN removal efficiencies at different operation stages.
Table 2. Comparison of different techniques for nitrogen removal from surface waters.