Figures & data
Table 1. Results of Box–Behnken experimental design.
Figure 1. Phylogenetic tree based on 16S rDNA sequences of strain CY-012.
Table 2. Variance analysis of the results from the Box–Behnken test.
Figure 2. Three-dimensional plots and contours of the quadratic model for fenvalerate degradation by strain CY-012. [Citation1] Response surface (A-1) and contour map (A-2) of the fenvalerate degradation rate (Y, %) as a function of the fenvalerate concentration (X1) and pH (X2) at a fixed concentration of ferric chloride (X3) of 0.051% (w/v). [Citation2] Response surface (B-1) and contour map (B-2) of the fenvalerate degradation rate (Y, %) as a function of the concentrations of ferric chloride (X3) and fenvalerate (X1) at a fixed pH value (X2) of 7.48. [Citation3] Response surface (C-1) and contour map (C-2) of the fenvalerate degradation rate (Y, %) as a function of the concentration of ferric chloride (X3) and pH (X2) at a fixed fenvalerate concentration (X1) of 44.04 mg L−1.
![Figure 2. Three-dimensional plots and contours of the quadratic model for fenvalerate degradation by strain CY-012. [Citation1] Response surface (A-1) and contour map (A-2) of the fenvalerate degradation rate (Y, %) as a function of the fenvalerate concentration (X1) and pH (X2) at a fixed concentration of ferric chloride (X3) of 0.051% (w/v). [Citation2] Response surface (B-1) and contour map (B-2) of the fenvalerate degradation rate (Y, %) as a function of the concentrations of ferric chloride (X3) and fenvalerate (X1) at a fixed pH value (X2) of 7.48. [Citation3] Response surface (C-1) and contour map (C-2) of the fenvalerate degradation rate (Y, %) as a function of the concentration of ferric chloride (X3) and pH (X2) at a fixed fenvalerate concentration (X1) of 44.04 mg L−1.](/cms/asset/bd117a0a-6b1d-40df-ab6c-7b89e1ee588e/tbeq_a_1438210_f0002_b.gif)
Figure 3. GC–MS chromatogram of metabolites of fenvalerate degraded by B. licheniformis CY-01.
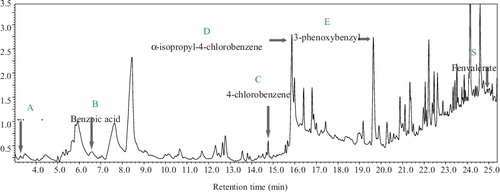
Table 3. Chromatographic characteristics of the products of fenvalerate degradation by Bacillus licheniformis CY-012.
Figure 4. GC–MS chromatogram of metabolites of 3-PBA degraded by B. licheniformis CY-012.
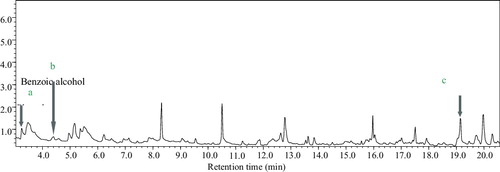
Table 4. Chromatographic characteristics of the degradation products of 3-PBA generated by Bacillus licheniformis CY-012.
Table 5. Degradation of intermediate metabolites.
Figure 5. Proposed metabolic pathway of fenvalerate degradation by B. licheniformis CY-012.