Figures & data
Figure 1. Multiple sequence alignment of the predicted GmSnRK1 protein with its homologous proteins from other plant species.
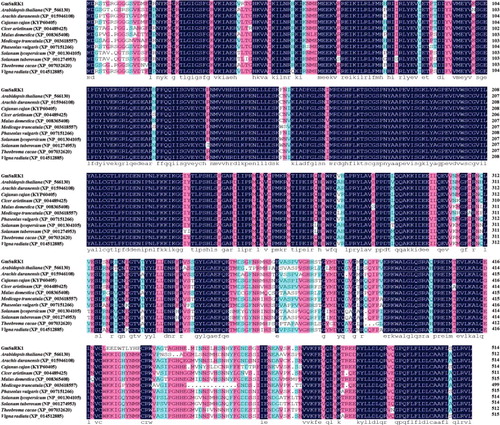
Figure 2. Phylogenetic tree of the predicted GmSnRK1 protein with its homologous proteins from other plant species.
Figure 3. Subcellular localisation of the GmSnRK1 protein in onion epidermal cells. (a) Schematic diagram of the 35S::GFP vector construct and 35S-GmSnRK1::GFP vector construct. (b) Transformed cells of the 35S::GFP and 35S-GmSnRK1::GFP constructs cultured in MS medium at 28 °C for 24 h and observed under a microscope.
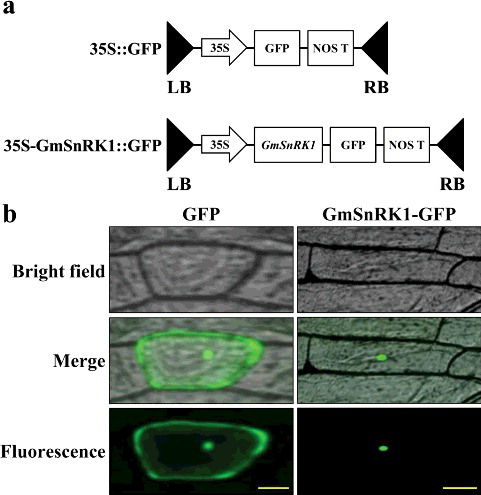
Figure 4. Molecular confirmation of transgenic plants. (a) Schematic diagram of the T-DNA region of binary plasmid pCAMBIA1301-GmSnRK1. LB, left border; RB, right border; hpt II, hygromycin phosphotransferase II gene; GmSnRK1, soybean sucrose non-fermenting-1 related protein kinase 1 gene; gusA, β-glucuronidase gene; 35S, cauliflower mosaic virus (CaMV) 35S promoter; 35S T, CaMV 35S terminator; NOS T, nopaline synthase terminator. (b) PCR analysis of GmSnRK1 overexpressing Arabidopsis plants. Lane M: DL2000 DNA marker; Lane W: water as negative control; Lane P: plasmid pCAMBIA1301-GmSnRK1 as positive control; Lane WT: wild type; VC, control vector; Lanes #1–#8: different transgenic lines. (c) Expression levels of GmSnRK1 in different transgenic lines. The Arabidopsis actin gene was used as an internal control. Data are presented as means ± SE (n = 3). * P < 0.05 and ** P < 0.01, significant differences compared to WT (Student's t-test).
Figure 5. Sucrose, glucose, fructose and soluble sugar content in the leaves of WT and transgenic plants.
Figure 6. Starch content analysis in the leaves of WT and transgenic plants.
Figure 7. Southern blot analysis of the transgenic plants to detect the copy number of integrated GmSnRK1 gene.
Figure 8. Transcript levels of starch biosynthesis genes in the leaves of WT and transgenic plants.
Figure 9. SUS, SPS, AGPase, GBSS, SSS and SBE enzyme activity in the leaves of WT and transgenic plants.
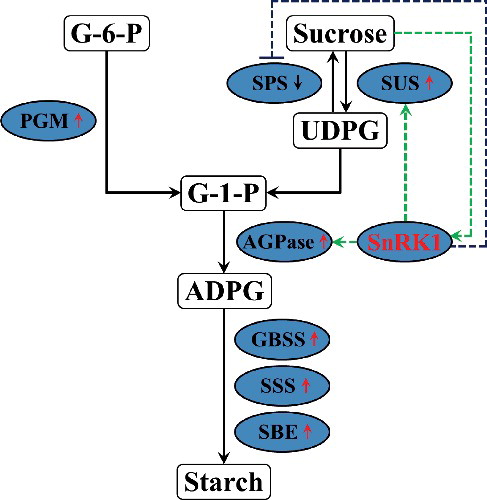
Figure 10. A proposed model of the regulatory network of GmSnRK1 in starch accumulation.