Figures & data
Figure 1. Redox-cycle of nitroxide and dynamics of its MRI/EPR contrast in living cells and tissues (original scheme; reprinted with permission from Zhelev et al. [Citation31] Copyright © 2012 Elsevier Ltd.)
![Figure 1. Redox-cycle of nitroxide and dynamics of its MRI/EPR contrast in living cells and tissues (original scheme; reprinted with permission from Zhelev et al. [Citation31] Copyright © 2012 Elsevier Ltd.)](/cms/asset/67dd8821-80a5-40c9-9904-770d5081af86/tbeq_a_1573153_f0001_c.jpg)
Figure 2. Structural formula and mechanism of lowering plasma cholesterol by bile acid sequestrant cholestyramine. Bile acids are synthesized in the liver from cholesterol and secreted to the intestine through the gallbladder. Cholestyramine binds bile acids in the gastrointestinal tract, prevents their re-absorption and increases their excretion from the organism. The low level of bile acids in the portal vein and liver induces synthesis of bile acids ‘de novo’, which is accompanied by consumption of cholesterol and its removal from the plasma. Thus, plasma cholesterol decreases.
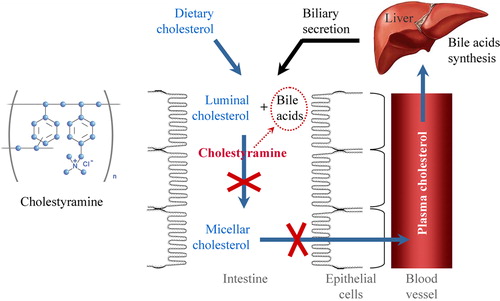
Figure 3. (A) Plasma cholesterol levels in mice on high cholesterol diet with and without cholestyramine. TC, total cholesterol; non-HDL-C, non-HDL cholesterol; HDL-C, HDL-cholesterol; CD mice, mice on cholesterol diet; CC, mice on cholesterol plus cholestyramine diet. (B) Biochemical test of serum for renal functionality. TP, total protein; BUN, blood urea nitrogen; CRE, creatinine; UA, uric acid. The control level of each parameter in the plasma of mice on normal diet was considered 100% (red dotted lines). All parameters were measured on the 15th week after feeding. The results are means ± SE. ns, non-significant versus control group; ***P < 0.001, **P < 0.01, *P < 0.05, ns, non-significant versus control group; +++P < 0.001, ++P < 0.01, +P < 0.05; NS, non-significant versus CD group. Each group consisted of 6 mice.
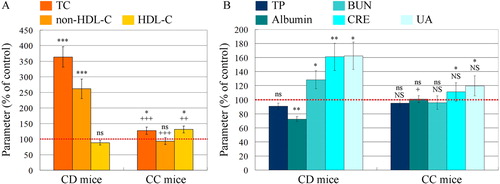
Figure 4. Haematoxylin and eosin staining of tissue sections of kidneys isolated from mice on normal diet (A) and cholesterol diet (B). The mice were 20 weeks of age. The images indicate glomerular and tubular damage.
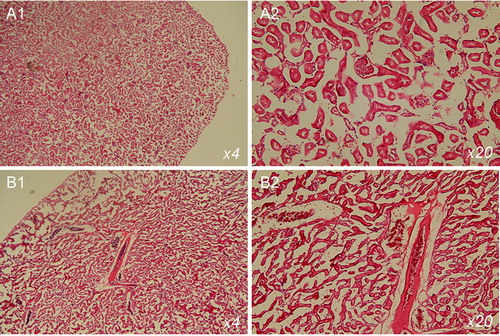
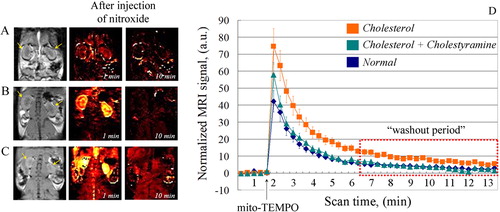
Figure 5. (A–C) Representative nitroxide-enhanced magnetic resonance images of kidneys in mice on: normal diet (A); cholesterol plus cholestyramine diet (B) or cholesterol diet (C). Black and white image: T1-weighted MR images of kidneys before injection of mito-TEMPO. Colour images: extracted MRI signal intensity after injection of mito-TEMPO, normalized to the averaged baseline level (before injection of mito-TEMPO). The yellow arrows indicate the kidneys. (D) Kinetic curves of the normalized MRI signal before and after injection of mito-TEMPO in mice on normal diet (n = 5), cholesterol diet (n = 7) and cholesterol plus cholestyramine diet (n = 7) (n, number of mice in each experimental group). The data are means ± SD.