
Figures & data
Figure 1. Phenotype distribution of RIL3613.
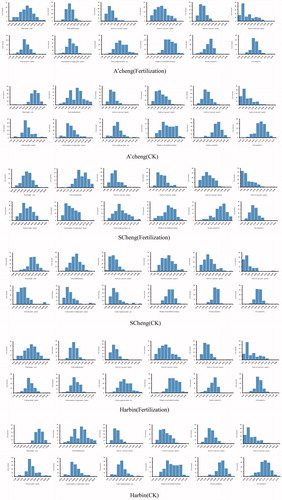
Figure 2. Phenotype distribution of RIL6013.
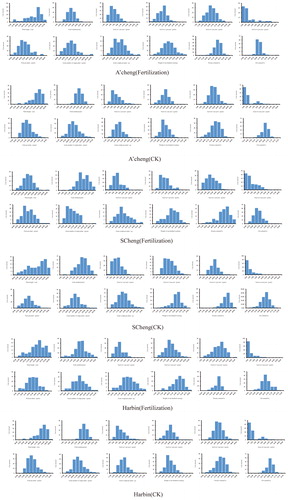
Table 1. QTL mapping information.
Table 2. Consensus QTL intervals and distribution of candidate genes for related traits on five linkage groups.
Table 3. Annotation of candidate genes associated with consensus QTLs.