Figures & data
Figure 1. Modified map of tryptophan metabolic network.
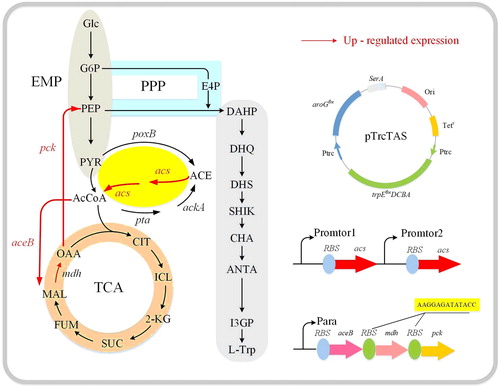
Table 1. The strains and plasmids used in the experiment.
Table 2. Primers used in study.
Table 3. Apparent kinetic constants determined for the ACS of the different strains.
Figure 2. Growth curves of different strains.
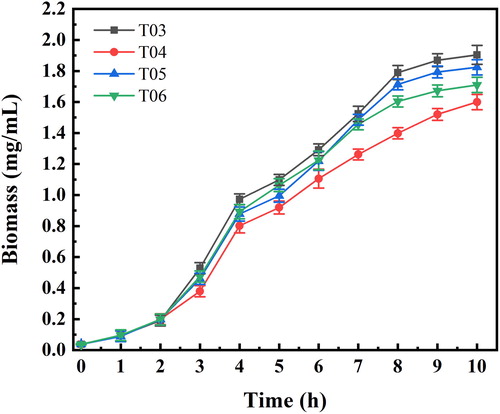
Figure 3. Relative transcriptional levels of GFP genes regulated by different promoters.
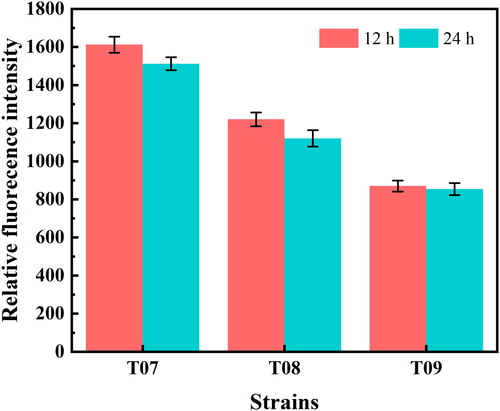
Figure 4. Relative transcriptional level of acs (A), pta and ackA (B), cell growth (C), tryptophan yield (D) and acetic acid (E) production after shake flask cultivations of the different E. coli strains.
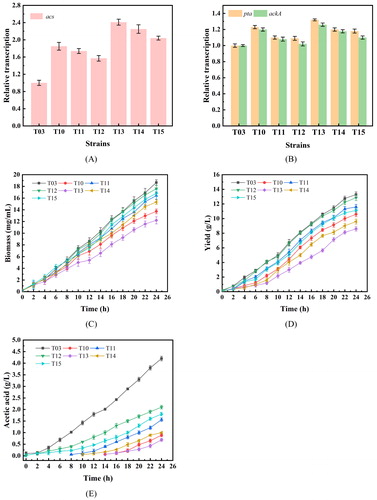
Table 4. Results of shake flask cultivations of the different E. coli strains.
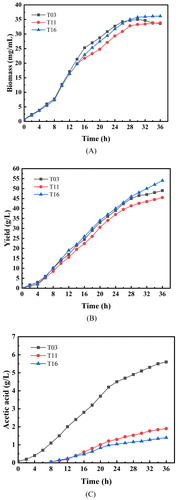
Figure 5. Cell growth (A), tryptophan yield (B) and acetic acid production (C) of the engineered strains T03, T11 and T16 after fed-batch fermentation in a 5-L bioreactor. Note: Data are average values of at least 3 experiments.