Figures & data
Figure 1. Schematic representation of different types of GAPDH in glycolysis and the Calvin cycle in a plant cell. Modified from Yang and Zhai [Citation14] and Zaffagnini [Citation15]. Left: The reaction of glycolysis under abiotic stress conditions with GAPN (non-phosphorylated form) and GAPC. Under oxidative stress conditions, GAPC might undergo glutathionylation. Then, GAPC activity is inhibited and results in down-regulation of the glycolysis pathway. Subsequently, this reaction prompts glucose equivalents to enter the pentose phosphate pathway, leading to the generation of NADPH (red arrow). The thiolate anion (-S-) in GAPC-S- is converted by H2O2 into sulfenic acid (GAPC-SOH). The GAPC-SOH interacts with PLDδ to generate phosphatidic acid (PA) leading to stomatal closure and activation of MAPK cascades [Citation14,Citation15]. Right: The catalytic reaction of GAPA/B and GAPCp in the chloroplast and plastid, respectively. Note: BPGA, 1,3-bisphosphoglycerate; G3P, glyceraldehyde-3-phosphate; DHAP, dihydroxyacetonephosphate; 3PGA, 3-phosphoglycerate; RuBP, ribulose-1,5-bisphosphate; RP, ribulose-5-bisphosphate.
![Figure 1. Schematic representation of different types of GAPDH in glycolysis and the Calvin cycle in a plant cell. Modified from Yang and Zhai [Citation14] and Zaffagnini [Citation15]. Left: The reaction of glycolysis under abiotic stress conditions with GAPN (non-phosphorylated form) and GAPC. Under oxidative stress conditions, GAPC might undergo glutathionylation. Then, GAPC activity is inhibited and results in down-regulation of the glycolysis pathway. Subsequently, this reaction prompts glucose equivalents to enter the pentose phosphate pathway, leading to the generation of NADPH (red arrow). The thiolate anion (-S-) in GAPC-S- is converted by H2O2 into sulfenic acid (GAPC-SOH). The GAPC-SOH interacts with PLDδ to generate phosphatidic acid (PA) leading to stomatal closure and activation of MAPK cascades [Citation14,Citation15]. Right: The catalytic reaction of GAPA/B and GAPCp in the chloroplast and plastid, respectively. Note: BPGA, 1,3-bisphosphoglycerate; G3P, glyceraldehyde-3-phosphate; DHAP, dihydroxyacetonephosphate; 3PGA, 3-phosphoglycerate; RuBP, ribulose-1,5-bisphosphate; RP, ribulose-5-bisphosphate.](/cms/asset/c32b67f3-338c-4248-9161-d1fde4c5ea63/tbeq_a_1719020_f0001_c.jpg)
Figure 2. Nucleotide (a) and amino-acid (b) sequence alignments of the two ecotypes of Leymus chinensis. (a) Nucleotide sequence alignment of GAPC cDNA in the two ecotypes; (b) Amino acid sequence alignment of the predicted GAPC proteins in the two ecotypes. The sequences were compared using DNAMAN software. Dark blue color denotes 100% similarity. Light blue color denotes non-identical residues.
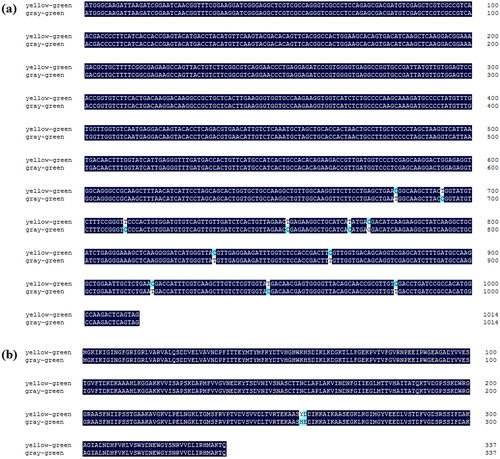
Figure 3. Phylogenetic tree of predicted amino acid sequences of LcGAPC in the two ecotypes. The analysis was performed using the NJ method with 1000 bootstraps in MEGA5 software.
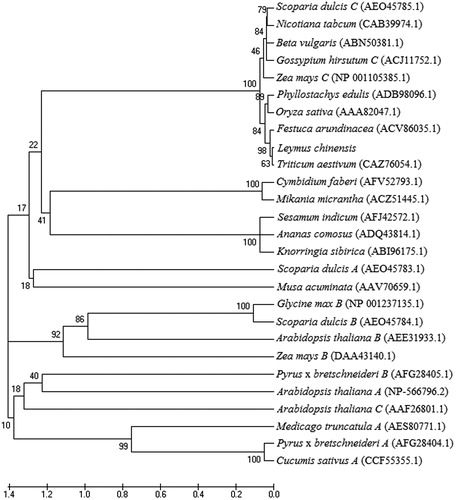
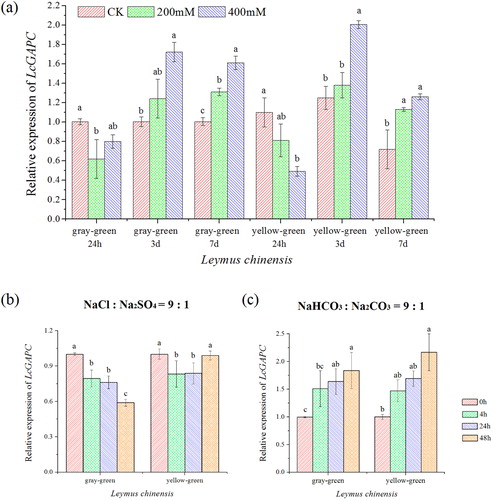
Figure 4. Relative LcGAPC expression in the yellow–green type and gray–green type of Leymus chinensis in different growth stages. The letters represent the significant differences in each ecotype of L. chinensis in different growth stages (p< .05). Asterisks (**) indicate a significant difference in the two ecotypes of L. chinensis at the same growth period (p<.01).
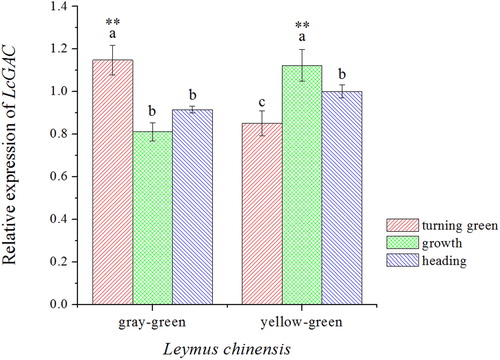
Figure 5. Phenotypes of Leymus chinensis under different NaCl treatments for 7 d.
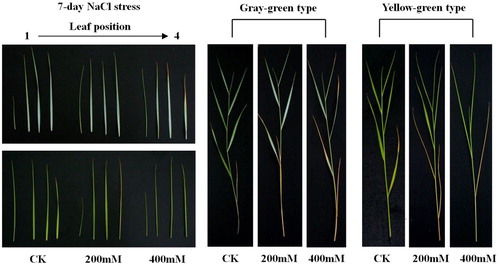
Figure 6. Relative mRNA expression levels of LcGAPC. (a) Expression level of LcGAPC in different concentrations of NaCl at different times; (b) Expression level of LcGAPC compared with different stress times under 200 mmol/L mixed salt stress; (c) Expression level of LcGAPC compared with different stress times under 200 mmol/L mixed alkali stress. The letters represent the significant differences among different salt-stress treatments, p<.05.