Figures & data
Table 1. GC-MS data of the volatiles of the extracts of Arum maculatum roots.
Figure 1. Antiangiogenic effects of A. maculatum extracts against EA.hy926 cells after 72 h. exposure (МТТ-assay).
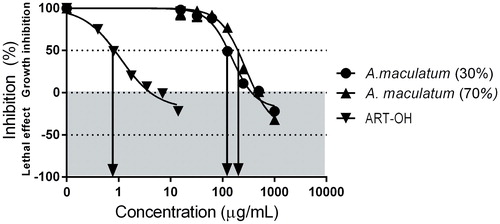
Table 2. Antiproliferative effects of the tested A. maculatum extracts against EA.hy926 vascular endothelial cells (MTT-dye reduction assay).
Figure 2. Inhibition of collagenase activity by A. maculatum extracts.
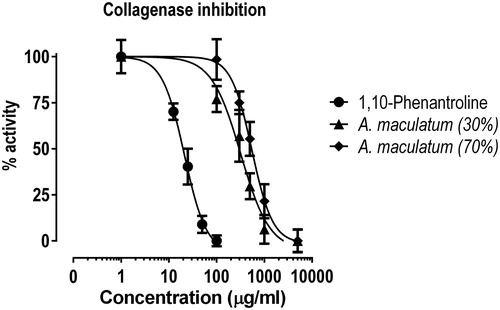
Table 3. Inhibitory activity of the tested extracts on bacterial collagenase.
Table 4. Inhibitory effects of the tested extracts on cyclooxygenase (COX-1 and COX-2) activities.
Figure 3. Effects of A. maculatum hydro-alcoholic extracts on PHA/PMA-induced secretion of IL-2 in Jurkat E.6 cells (human Т-cell model).
Note: * Indicates statistical significance at p < 0.05 vs. PHA + PMA alone; # indicates significant difference vs. the 70% EtOH extract; paired t-test.
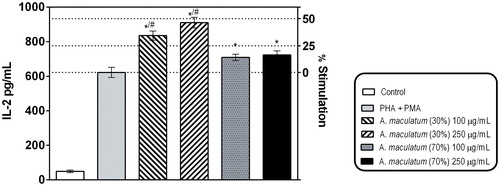
Figure 4. Concentration dependence of the anti-radical activity of the 30% EtOH extract determined in stable free radical-based systems.
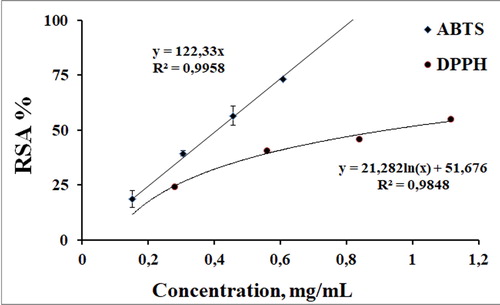
Figure 5. Typical chemiluminescent curves obtained in the chemilumiescent model systems used for evaluation of the superoxide anion and hypochlorte scavenging activity.
Note: X-axis, time of analysis [s]; Y-axis, intensity of chemiluminescence signal - relative units [RU]. Blank samples contained PBS, the tested antioxidants, and the reaction-intitiating agents; control samples contained PBS, luminol and the reaction-initiating agents but without the tested antioxidants.
![Figure 5. Typical chemiluminescent curves obtained in the chemilumiescent model systems used for evaluation of the superoxide anion and hypochlorte scavenging activity.Note: X-axis, time of analysis [s]; Y-axis, intensity of chemiluminescence signal - relative units [RU]. Blank samples contained PBS, the tested antioxidants, and the reaction-intitiating agents; control samples contained PBS, luminol and the reaction-initiating agents but without the tested antioxidants.](/cms/asset/18816f31-5b16-4da5-966b-32ec8efb27ec/tbeq_a_1722239_f0005_b.jpg)
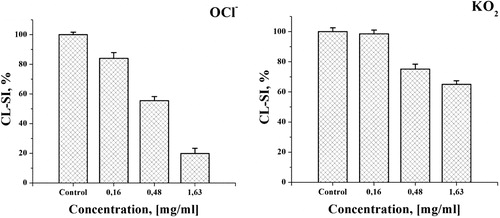
Figure 6. Effect of the 30% EtOH extract on the luminol dependent CL in model systems with different ROS: OCl¯ - system of NaOCl generated hypochlorite; O2•¯ - system of KO2 produced superoxide formation.