Figures & data
Figure 1. Central metabolism of S. cerevisiae.
Note: Reaction r1 is a lumped process of glucose conversion to become pyruvate and reaction ri, i = 2,…,7 is a chemical conversion catalysed by: (2) pyruvate decarboxylase, (3) pyruvate dehydrogenase complex, (4) alcohol dehydrogenase, (5) acetaldehyde dehydrogenase, (6) acetyl-CoA synthetase, (7) adenylate kinase. Glucose transport (GLT) becomes the input and some products flow out of the system with dilution rate
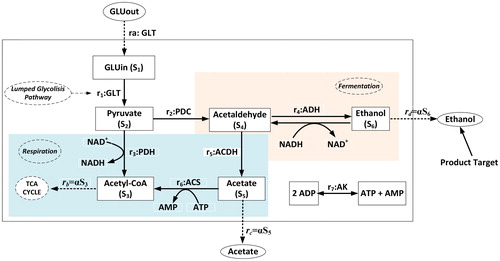
Figure 2. Sensitivity of ethanol flux to the regulation of the maximal activity of enzymes.
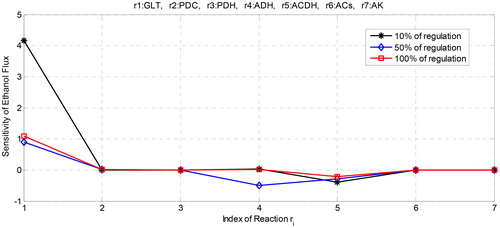
Table 1. Kinetic parameters of the model.
Figure 3. Profile of sensitivity of ethanol flux with respect to the regulation of the maximal activity of enzymes.
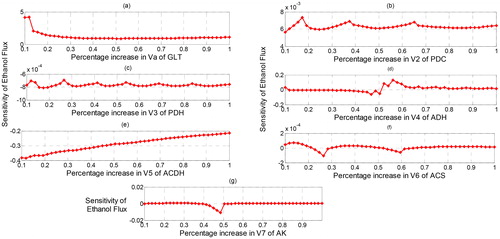
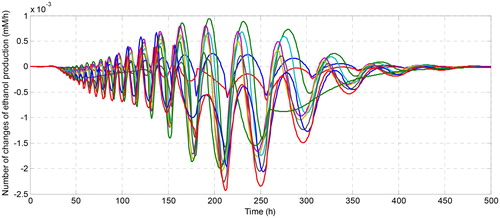
Figure 4. Number of change of ethanol production after increasing the maximal activity of all enzymes.
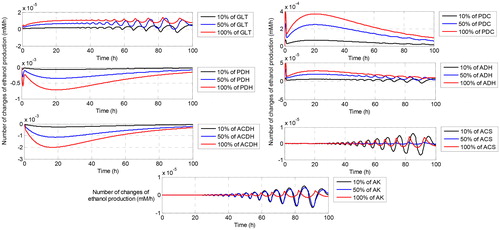
Figure 5. Number of change of ethanol production after increasing the initial concentration of NADH.
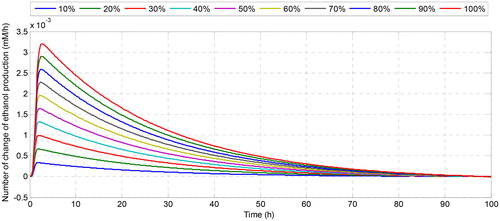
Figure 6. Number of change of ethanol production after increasing the initial concentration of NAD+.
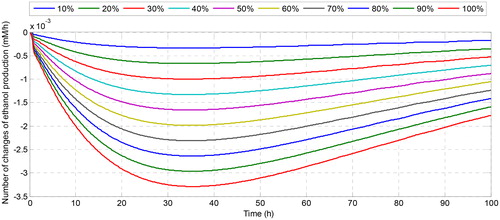
Figure 7. Number of change of ethanol production after increasing the initial concentration of ATP.