Figures & data
Figure 1. Phylogenetic analysis of the TeGST gene with the GST gene from other bacteria. The names of the corresponding genes are as follows: TeGST gene sequence of Thermosynechococcus elongatus (BA000039.2)/Thermosynechococcus vulcanos NIES-2134 (AP018202.2)/Thermosynechococcus sp. NK55(CP006735.1) /Thermosynechococcus elongatus PKUAC-SCTE542(CP032152.1)/Synechococcus lividus PCC 6715(CP018092.1) /Nostoc sp. NIES-4103(AP018288.1)/Anabaena sp. WA102 (CP011456.1)/Calothrix sp. NIES-2098(AP018172.1)/Cylindrospermum stagnale PCC 7417(CP003642.1)/Synechocystis sp. PCC 6714 (CP007542.1)). Evolutionary analyses were conducted in MEGA7 [2]. Numbers in branches are Bayesian posterior probabilities.
![Figure 1. Phylogenetic analysis of the TeGST gene with the GST gene from other bacteria. The names of the corresponding genes are as follows: TeGST gene sequence of Thermosynechococcus elongatus (BA000039.2)/Thermosynechococcus vulcanos NIES-2134 (AP018202.2)/Thermosynechococcus sp. NK55(CP006735.1) /Thermosynechococcus elongatus PKUAC-SCTE542(CP032152.1)/Synechococcus lividus PCC 6715(CP018092.1) /Nostoc sp. NIES-4103(AP018288.1)/Anabaena sp. WA102 (CP011456.1)/Calothrix sp. NIES-2098(AP018172.1)/Cylindrospermum stagnale PCC 7417(CP003642.1)/Synechocystis sp. PCC 6714 (CP007542.1)). Evolutionary analyses were conducted in MEGA7 [2]. Numbers in branches are Bayesian posterior probabilities.](/cms/asset/3265abf7-d1e7-413c-bcd7-ac37904ab95e/tbeq_a_1779127_f0001_b.jpg)
Figure 2. Expression profiles of WT and TeGST transgenic A. thaliana plants. (A) Semiquantitative PCR-amplified TeGST fragments from WT plants and transgenic lines (TG1, TG2, TG3, TG4 and TG5). Total RNA extracted from pooled tissue collected from T3 A. thaliana plants grown under normal conditions. The A. thaliana actin gene was used as the internal standard. The RT-PCR analysis revealed that the TeGST gene was expressed normally in the transgenic lines, but no expression was detected in the WT plants. (B) Relative transcript level analysis of different TeGST transgenic lines (TG1, TG2, TG3, TG4 and TG5). Values are means of three replications ± SD. Data are means from the analysis of three independent seed batches.
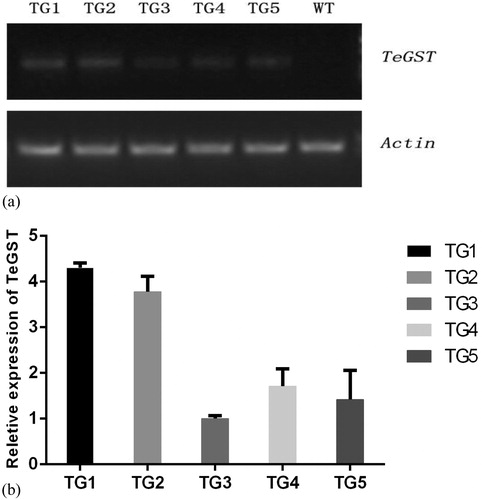
Figure 3. Effects of guanidine thiocyanate on seed growth of A. thaliana. (A) Growth of WT and transgenic plants sown on 0, 1, 3 and 5 mmol L−1 guanidine thiocyanate plate for 7 days. (B) Root length of WT and transgenic plants after growth 7 days on 0, 1, 3 and 5 mmol L−1 guanidine thiocyanate medium is as indicated. (C) Fresh weight of WT and transgenic plants after growth for 7 days on 0, 1, 3 and 5 mmol L−1 guanidine thiocyanate medium. Values are means of three replications ± SD. Different letters at the top of the bar indicate significant differences according to univariate ANOVA (p < 0.05). (D) Statistics on germination rates of WT and transgenic plants seeded on 0, 5 and 10 mmol L−1 guanidine thiocyanate plates 2, 3 and 4 days later. Values are means of two replications ± SD. Different letters at the top of the bar indicate significant differences according to univariate ANOVA (p < 0.05).
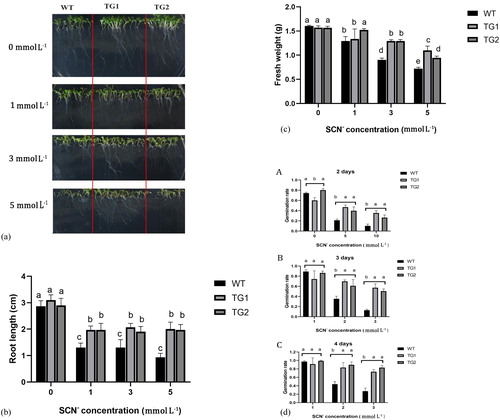
Figure 4. Residue analysis of guanidine thiocyanate by HPLC. WT and transgenic plants were cultured in liquid medium containing 4 mmol L−1 of guanidine thiocyanate. (A) Guanidine thiocyanate residue analysis of WT and transgenic lines (TG1, TG2) by HPLC. (B) Guanidine thiocyanate residue of blank control, WT and transgenic lines (TG1, TG2) are as indicated. Values are means of three replications ± SD. Different letters at the top of the bar indicate significant differences according to univariate ANOVA (p < 0.05).
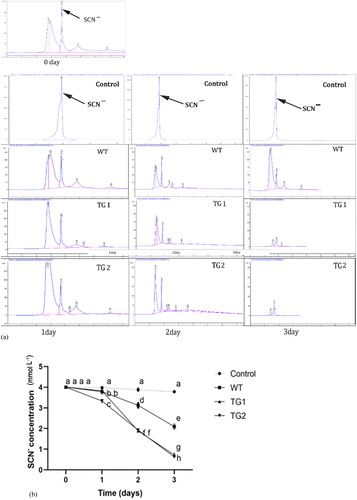
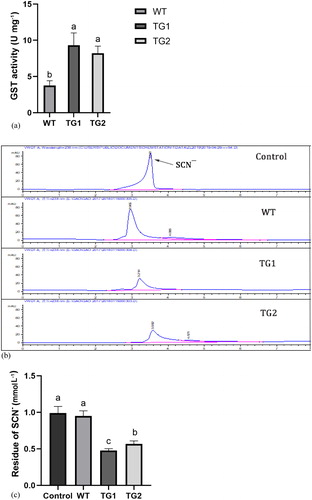
Figure 5. TeGST activity in crude protein extract in vitro. (A) GST activity in WT and transgenic plants (TG1, TG2). (B) HPLC analysis of guanidine thiocyanate residue after degradation by the crude protein of WT, TG1 and TG2. (C) Concentration of guanidine thiocyanate residue in a liquid medium in which blank control, WT and transgenic lines (TG1, TG2) were grown. Values are means of three replications ± SD. Different letters at the top of the bar indicate significant differences according to univariate ANOVA (p < 0.05).