Figures & data
Figure 1. Plant phenotype on the third day of drought stress. CK1, control group with normal watering; CK2, control group with drought only; S0.3, exogenous SA group with drought; and C10, exogenous CaCl2 group with drought.
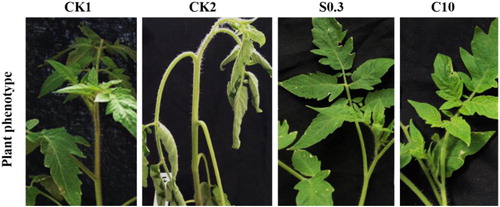
Figure 2. Seven differential expression patterns were used to analyze the drought resistance response induced by exogenous SA and CaCl2 in tomato. (A) Expressed in all groups; (B) induced by combination of drought and CaCl2 (expressed in C10 only); (C) induced by combination of drought and SA (expressed in S0.3 only); (D) repressed by drought stress (expressed in CK1, CKC and CKS); (E) repressed by combination of drought and exogenous substances (expressed in CK1, CK2, CKC and CKS); (F) repressed by drought or exogenous substances (expressed in CK1 only); and (G) induced by drought stress (expressed in CK2, C10 and S0.3).
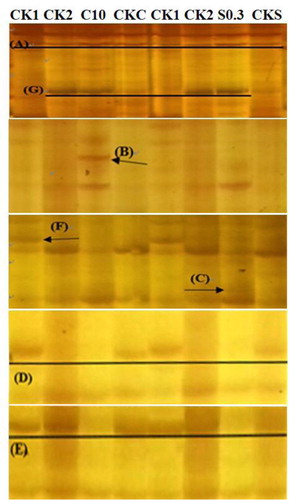
Table 1. Homology analysis of SA- and Ca2+-induced differentially expressed transcripts under drought in tomato.
Figure 3. qRT-PCR analysis of 12 differentially expressed transcripts induced by exogenous SA and CaCl2 under drought stress in tomato. Note: Mean values (n = 3) with standard deviation (±SD).
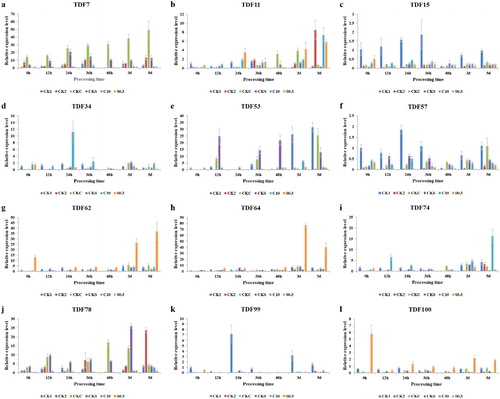
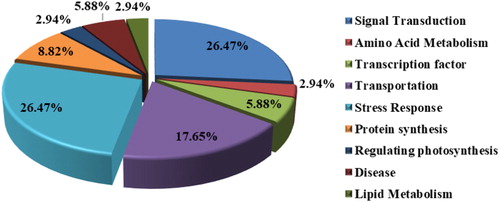
Figure 4. Functional annotation distribution of 34 differentially expressed fragments.