
Figures & data
Figure 1. Detailed information for 41 Juglans cultivars collected in the present study. (a) Geographic distribution of the Juglans populations in the present study. The solid circles in black, red and blue represent the origin of cultivars in the NC, ES and SS regions, respectively. (b) Phenotypic differences between the representative varieties of the three groups. MY has deep pits or seal-like depressions on the surfaces of the nuts and dark-colored kernels with tough septa, whereas XX2 has wrinkled nut surfaces, light-colored kernels and papery septa. The nut surface of CZ1 is relatively more similar to that of XX2. Source: Prof. Wei Gong.
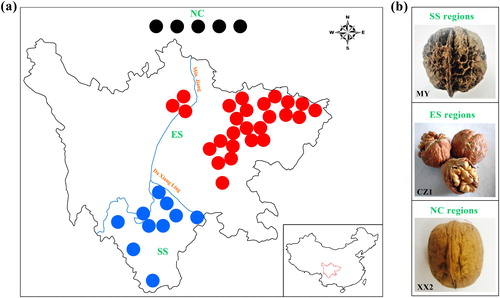
Table 1. P-distance among samples in three genetic groups of Juglans.
Table 2. Genetic diversity of the ES and SS groups of Juglans.
Figure 2. Maximum-likelihood trees representing the relationships among Juglans germplasms based on 6357 SNPs.
Note: The solid circles represent the SS genotypes, which are shown in dark blue (SS2) and light blue (SS1), diamonds represent the ES genotypes, which are shown in purple (ES1), orange (ES2) and green (ES3), triangles represent the NC genotypes, which are shown in purple.
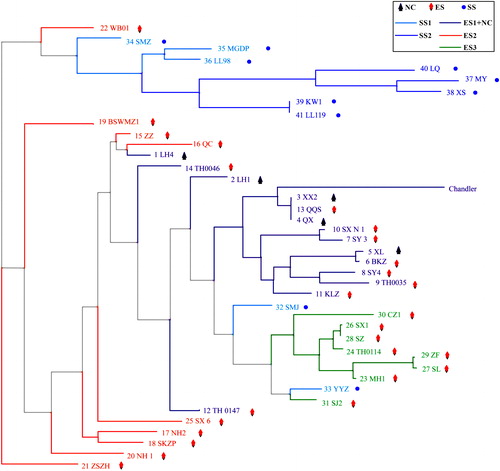
Figure 3. Principal coordinate analysis (PCoA) of the 41 walnut genotypes with 6357 SNPs.
Note: The PCoA results from the first two statistically significant components are shown (p < 0.05). The proportion of the variance explained by each PC is shown in parentheses along each axis. The groups include NC (1–5), ES (6–31) and SS (32-41).
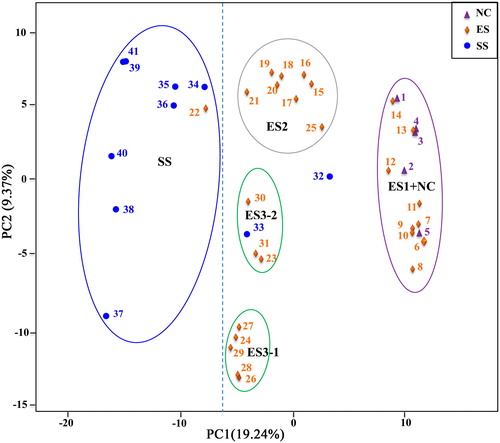
Figure 4. Population genetic structure of the 41 walnut genotypes with 6357 SNPs.
Note: The population structure inferred by the Bayesian approach based on RAD-SNPs for K values ranging from 2 to 5. Each cultivar is represented by a vertical line that is divided into colored segments according to the proportion of the division identified for 2–5 subpopulations. The groups include NC (1–5), ES (6–31) and SS (32–41).
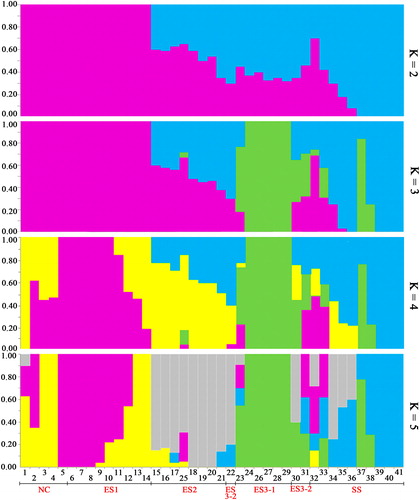
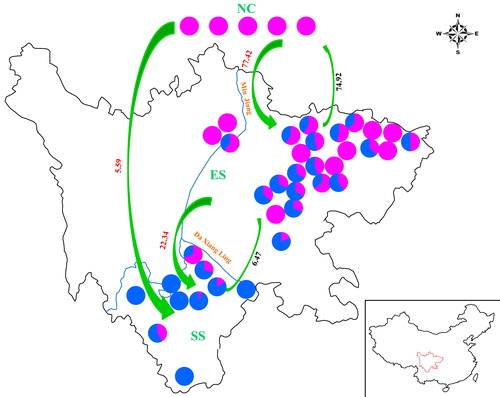
Figure 5. Comparison of genetic structure distribution rates in 41 walnut genotypes. Source: Prof. Wei Gong.
Note: The pie chart in each location represents the proportions of cultivars belonging to the corresponding subgroups in the NC, ES and SS groups. The green arrows and the numbers in red and black are the gene flow direction and gene flow rates estimated in the present study.
Supplemental Material
Download PDF (267.4 KB)Supplemental Material
Download PDF (109.4 KB)Availability of data and materials
The data supporting the results presented in this article are included as additional files. All RAD-seq data in this study are archived in European Variation Archive database with the project number PRJEB36778.