Figures & data
Figure 1. Phenotypic characterization of ears of the two maize hybrids. (a, b) Ear phenotypes. (c) Ear length. (d) Ear bare tip length. (e) Kernel rows per ear. (f) Kernels per row.
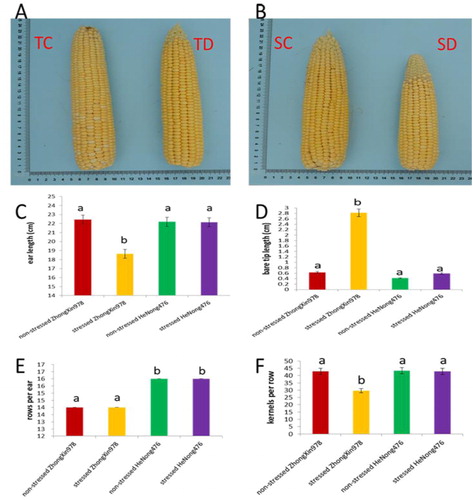
Figure 2. Number and grouping of DAPs. (a) Histogram of the number distribution of DAPs in four comparison groups. (b) Venn diagram analysis of DAPs identified in the four experimental comparisons. (c) Cluster analysis of DAPs in SD_TD comparison.
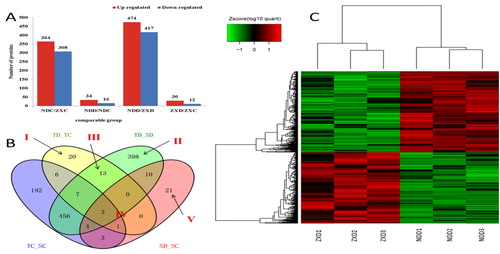
Table 1. DAPs observed specifically in tolerant hybrid ND476.
Table 2. DAPs showed differentially expressed in both the tolerant and sensitive hybrids after drought treatment.
Table 3. Common (overlapping) drought-responsive DAPs in filling seed between ND476 and ZX 978.
Table 4. Drought-responsive maize seedling leaf proteins observed specifically in sensitive hybrid ZX 978.
Figure 3. GO functional classification of drought responsive proteins. (a) ND 476 specific DAPs. (b) ZX 978 specific DAPs. The y-axis represents the number of proteins in each function; x-axis displays the protein functions, categorized into three broad biological functional groups.
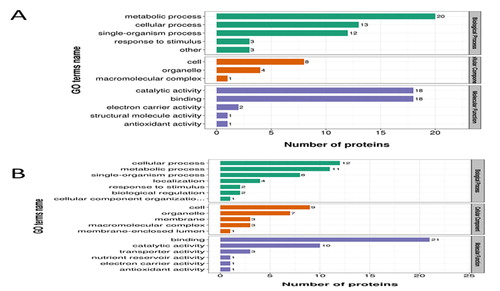
Figure 4. KEGG pathway enrichment analysis of DAPs. (a) Most significantly enriched pathways in TD_TC. (b) Most significantly enriched pathways in SD_SC. The size of the point represents the number of DAPs. TC, tolerant cultivar (ND476) under control conditions; TD, tolerant cultivar under drought conditions; SC, sensitive cultivar (ZX978) under well-watered (control) conditions; SD, sensitive cultivar under drought treatment conditions. An underscore between two genotype-treatment combinations represents comparison between those combinations, for example, TD_TC.
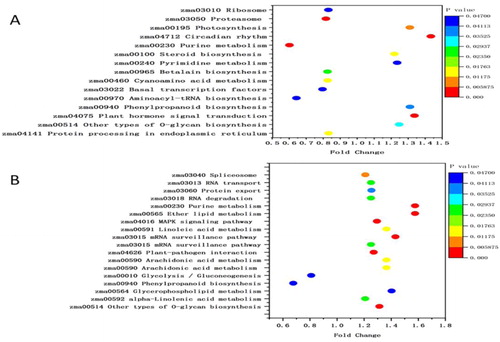
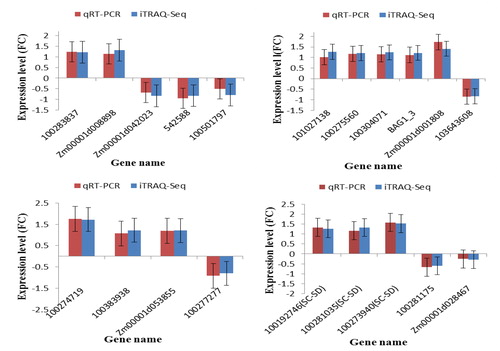
Figure 5. Confirmation of the iTRAQ-seq results by qRT-PCR. (a) DAPs specific to TD_TC; (b) DAPs specific to SD_TD; (c) DAPs shared between TC_TD and SD_SC; and (d) Common DAPs shared between TD_TC and TD_SD. The y-axis represents expression levels (fold change). Maize gene GAPDH (accession no. X07156) was used as the internal reference. Error bars represent the SE (n = 3). TC, tolerant cultivar (ND 476) under control conditions; TD, tolerant cultivar under drought conditions; SC, sensitive cultivar (ZX 978) under well-watered (control) conditions; SD, sensitive cultivar under drought treatment conditions. An underscore between two genotype-treatment combinations represent comparison between those combinations, for example, TD_TC.