
Figures & data
Table 1. Primers used in this study.
Figure 1. Different stages of fruiting bodies of Auricularia heimuer. A, B and C represent primordium (A), immature fruiting bodies (B) and mature fruiting bodies (C) in cultivation bags, while a, b and c indicate materials collected from the corresponding cultivation bags.
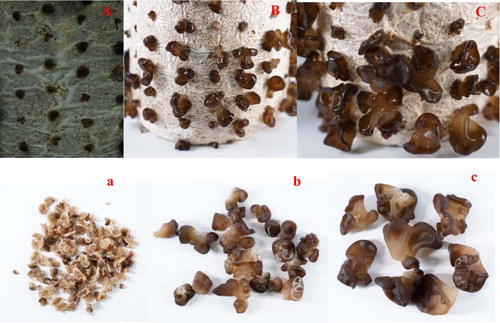
Figure 2. Nucleotide sequence and deduced amino acid sequence of Aa-bgl.
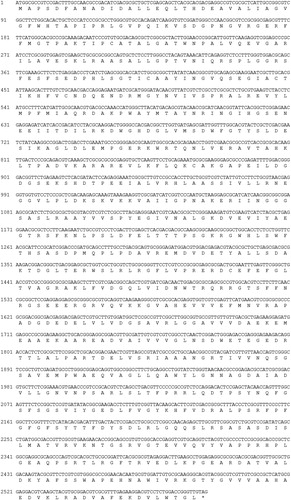
Figure 3. Amino acid content of the Aa-bgl protein.
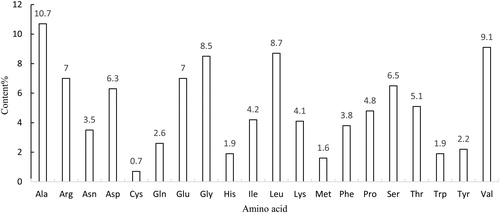
Figure 4. Conserved domains in the Aa-bgl protein.
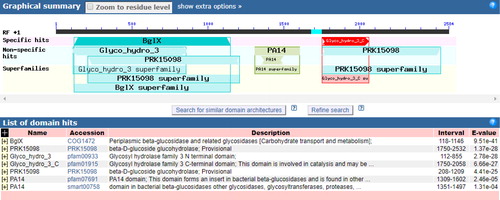
Figure 5. Transmembrane region prediction for the Aa-bgl protein.
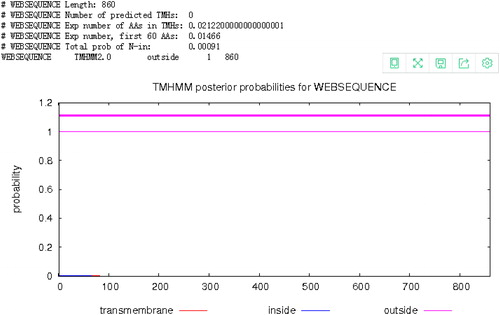
Figure 6. Signal peptide prediction for the Aa-bgl protein.
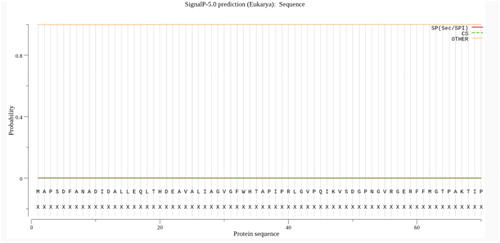
Figure 7. Structural and expression analysis of the Aa-bgl protein. (a) Tertiary structure prediction. (b) SDS-PAGE analysis following induction of expression by IPTG (1 mmol/L). M, protein molecular weight markers (Solarbio); Lane 1, E. coli transformed with pET-32a; Lanes 2–7, E. coli transformed with pET-32a-bgl induced with IPTG for 0, 2, 4, 6, 8 and 10 h, respectively.
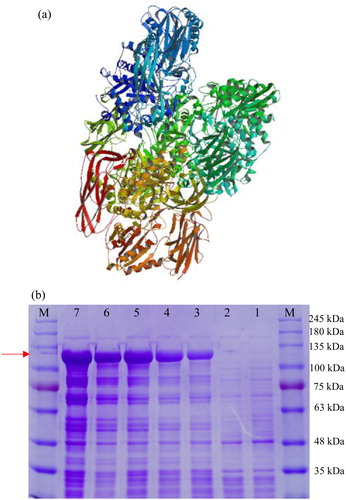
Figure 8. Phylogenetic tree of A. heimuer Aa-bgl and homologs from various species.
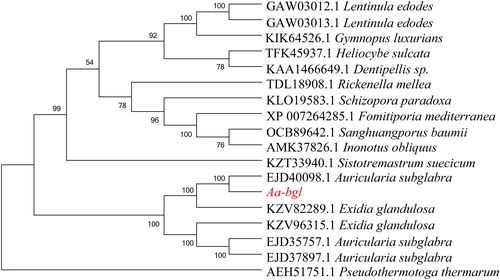
Table 2. Sequences of Aa-bgl homologs in various species.
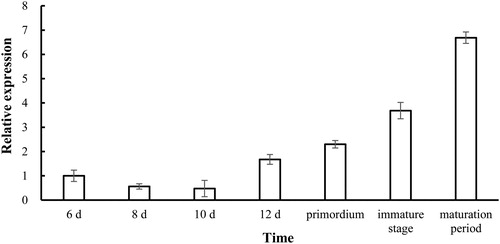
Figure 9. Aa-bgl transcription levels at different stages of A. heimuer development.
Note: Values are means ± standard deviation from three experiments.
Data availability statement
The data that support the findings of this study are available on request from the corresponding author, [Z]. The data are not publicly available due to their containing information that could compromise the privacy of research participants.