
Figures & data
Table 1. Primers used for qRT-PCR analysis.
Figure 1. Effect of elevated CO2 on eggplant growth. Dynamics of plant height (A), stem diameter (B), plant width (C) and leaf numbers (D) of eggplant.
Note: Bars represent mean values ± SD (n = 3) of triplicate repeats. Upper case letters in each panel indicate significant differences among samples by Student’s t-test at p < 0.01 and lower case letters indicate significant differences at p < 0.05.
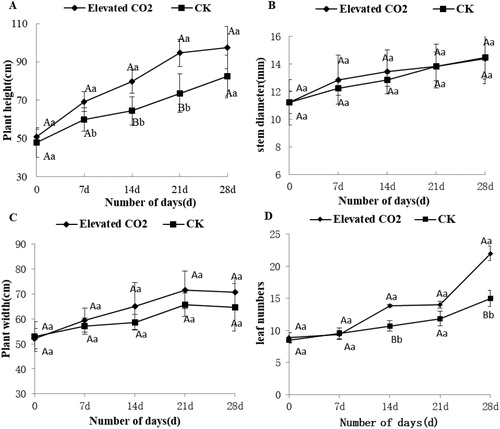
Table 2. Effect of elevated CO2 on photosynthesis in eggplant.
Figure 2. Gene ontology(GO) analysis of differential expressed genes (DEGs) from eggplant. A total of 169 DEGs were categorized into 53 function items.
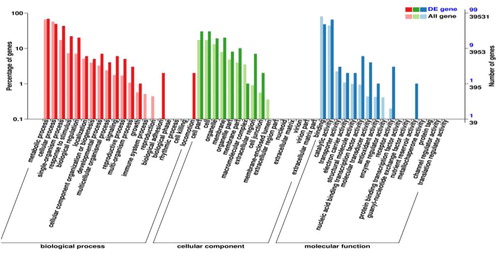
Figure 3. KEGG analysis of differential expressed genes(DEGs). A total of 49 pathways were identified.
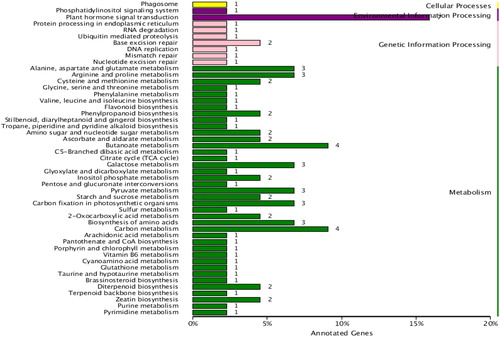
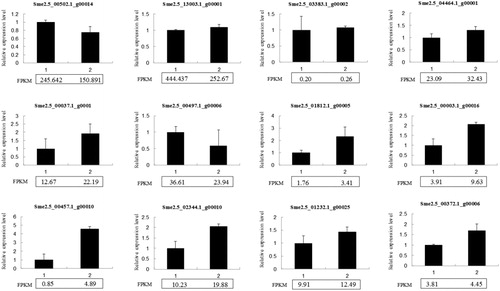
Figure 4. qRT-PCR validation of 12 differential expressed genes (DEGs). The FPKM value of each gene from RNA-seq was marked in panel under the diagram of qRT-PCR.
Supplemental Material
Download MS Excel (239.5 KB)Data availability
The authors confirm that the data supporting the findings of this study are available within the article and its supplementary materials.