Figures & data
Table 1. Primers used for real-time fluorescence quantitative PCR.
Figure 1. Comparison of leaf growth in strawberry under elevated and ambient CO2 concentrations. Petiole length (a), leaf width (b) and leaf length (c) under two different CO2 levels. Note: Data are mean values with standard error (±SEM) of three independent experiments (n = 3) with at least three measurements for each replicate. *P < 0.05.
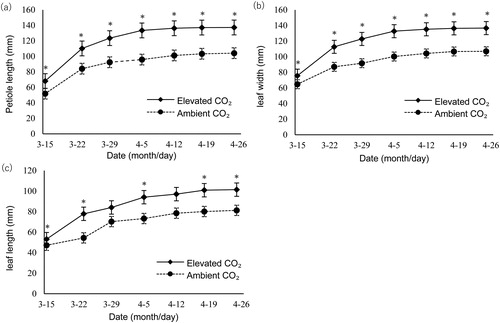
Figure 2. Comparison of light response curves of strawberry leaves under different CO2 concentrations.
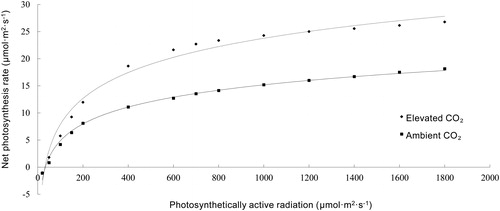
Table 2. Comparison of photosynthetic parameters of strawberry leaves under elevated and ambient CO2 concentrationsTable Footnote*.
Table 3. RNA-Seq data statistics.
Table 4. Differentially expressed genes under different CO2 concentrations.
Table 5. GO enrichment analysis of DEGs under different CO2 concentrations.
Table 6. Representative genes with >10-fold expression change under carbon-rich condition in strawberry.
Figure 3. KEGG enrichment analysis of DEGs.
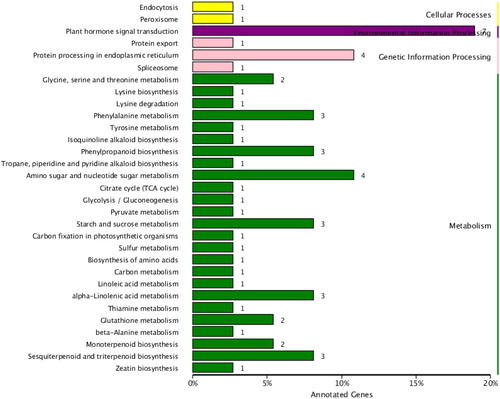
Table 7. Comparison of strawberry genes and Arabidopsis homologs under ambient and elevated CO2 concentrations.
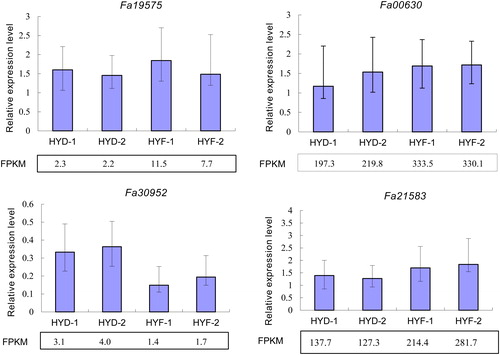
Figure 4. Quantitative real-time PCR validation of RNA-Seq data based on gene expression levels. FPKM, reads per kb per million reads. Note: The strawberry ACTIN gene was used as an internal reference. Columns with error bars indicate relative quantification (RQ). RQmax and RQmin were calculated using an ABI 7500 instrument.