
Figures & data
Table 1. List of primers used in this study.
Figure 1. Schematic depictions of strategies to sort single alpaca antigen specific memory B cells.
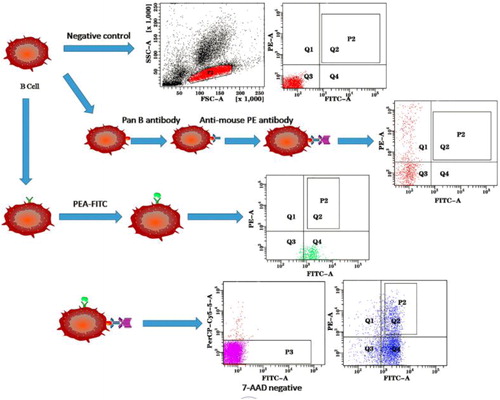
Figure 2. Amplification of Nb genes by nested PCR. (A) The second PCR amplification using the CHPCitation1 and CHPCitation2 primer pair to distinguish the conventional antibody from Nb, with all the 96 amplification results shown. (B) Amplification of Nb genes in target samples by PCR with VHH primers and 24 amplification results shown.
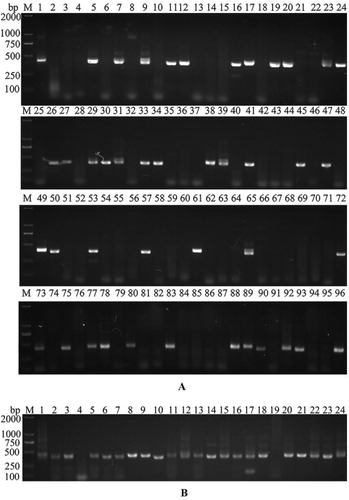
Figure 3. Purification and SDS-PAGE analysis of 12 Nbs expressed in E. coli.
Note: 12 Nbs were expressed in E. coli BL21 (DE3) and purified via Ni2+–NTA resin chromatography column and characterized by SDS-PAGE. The molecular weight of Nb is around 15 kD.
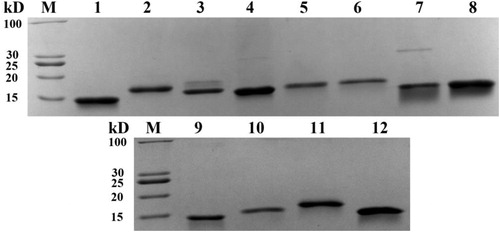
Figure 4. Affinity assay of Nbs binding to PEA.
Note: KD data between PEA and Nbs was obtained using Biacore T100 instruments. Four of the 12 Nbs showed strong binding activity to PEA antigen. Nb6, Nb8, Nb10 and Nb11 were immobilized on the chip surface and PEA dissolved in PBS at respective concentrations of 80, 40, 20, 10 and 5 μg/mL (C1–C5) were injected.
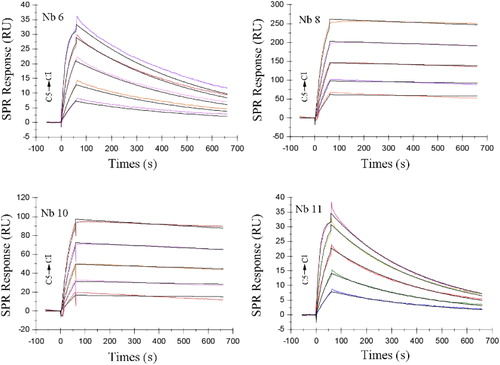
Table 2. Affinity of the 4 PEA-specific nanobodies with high affinity.
Figure 5. The half inhibitory concentration of four nanobodies to PEA toxin.
Note: PEA concentration of 5 μg/mL used.
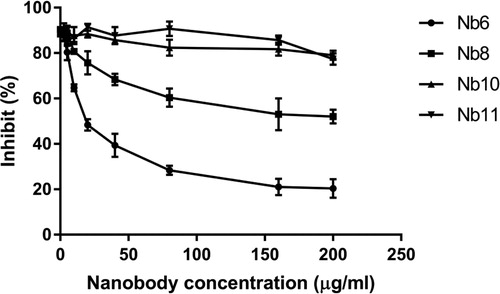
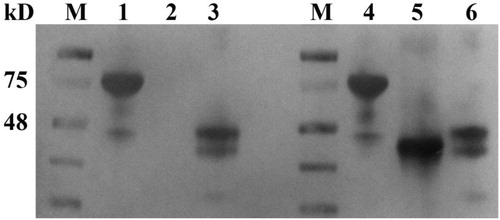
Figure 6. Western blot to detect the epitopes of the nanobodies. Lanes 1–3 with Nb8 as the primary antibody and PEA, tPEA1 and tPEA2 as respective antigens. Lanes 4–6 with Nb6 as the primary antibody and PEA, tPEA1 and tPEA2 as respective antigens.
Data availability statement
The data that support the findings of this study are available from the corresponding author upon reasonable request.