Figures & data
Table 1. Drought-responsive DAPs observed specifically in ND 476.
Figure 1. Phenotypic characterization of the two maize hybrid lines (drought-tolerant ND 476, T; and drought-sensitive ZX 978, S) ears’ responses to drought stress. Observations/measurements were made after 12 days of water-sufficient (control, C) or water-deficit (drought, D) conditions. (a-b) Ear phenotypes; (c) ear length; (d) ear bare tip length; (e) kernel rows per ear; (f) number of kernels per row. Data are presented as mean values ± standard errors (n = 3). Different letters on error bars indicate significant differences at p < 0.05; For c-f, each replication is an average for the measurement of 10 ears.
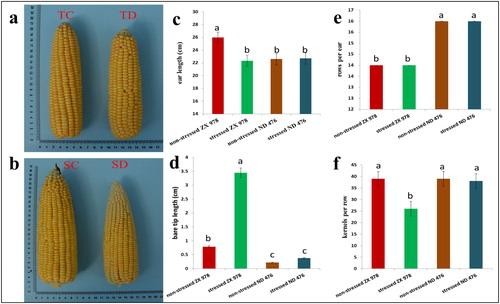
Figure 2. Analysis of differentially abundant proteins (DAPs) identified in four experimental comparisons. (a) Total number of DAPs identified in each experimental comparison group. Red (up-regulated) means DAPs with increased differential abundance. Green (down-regulated) means DAPs with decreased differential abundance; (b) Venn diagram analysis of DAPs identified in the four comparisons. DAPs uniquely expressed in TD_TC (I), SD_TD (II), SD_SC (III) are indicated with arrows. Area IV shows 18 overlapping DAPs within line. Overlapping regions of the Venns indicate DAPs shared between/among corresponding groups. (c) Clustering analysis of DAPs in SD_TD comparison. Each row represents a significantly abundantly expressed protein. ZXD1-3 (drought-sensitive ZX 978, S; drought, D) refer to the biological replicate number for ZX 978, whilst NDD1-3 (drought-tolerant ND 476, T; drought, D) refer to the replicate number for ND 476. The DAPs were clustered based on the differentially expressed levels. The scale bar indicates the logarithmic value (log2 fold change) expression of the DAPs. Red (log2 fold change > 0) indicates up-regulated DAPs and blue (log2 fold change < 0) indicates down-regulated DAPs.
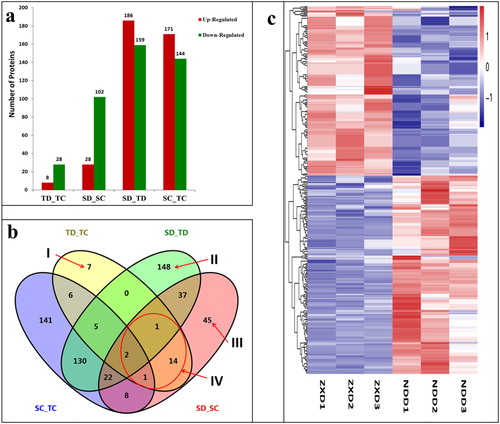
Table 2. Drought-responsive DAPs observed specifically in ZX 978.
Table 3. Overlapping drought-responsive DAPs between ZX 978 and ND 476.
Figure 3. Gene ontology (GO) functional classification of differentially abundant proteins (DAPs) under drought conditions. Most significantly enriched GO terms in tolerant hybrid line ND 476 (a) and sensitive hybrid line ZX 978 (b). Note: The number above each bar graph shows the enrichment factor of each GO term. Red indicates up-regulated and blue indicates down-regulated.
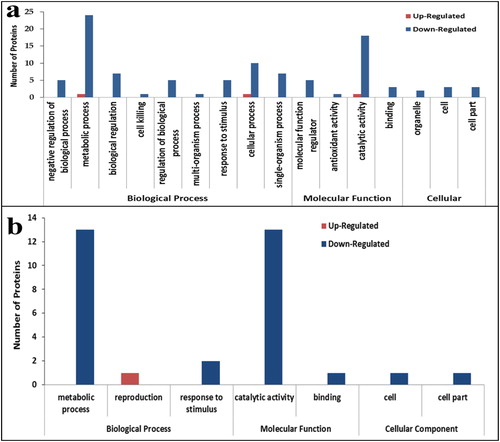
Figure 4. KEGG pathway enrichment analysis of the DAPs; TD_TC comparison (a); SD_SC comparison (b). Note: The bubble size represents the number of DAPs enriched in the corresponding pathway. The vertical coordinate shows KEGG pathway. The horizontal coordinate shows the enrichment factor (rich factor ≤ 1), and the enrichment factor indicates the number of differentially abundant proteins (DAPs) participating in a KEGG pathway as a proportion of proteins involved in the pathway in all identified proteins. The significance of the enrichment of the KEGG pathway is based on Student’s t-test, q < 0.05. The color gradient represents the size of the q value; the color is from blue to red, and the nearer red represents the smaller q value, the higher the significant level of enrichment of the corresponding KEGG pathway.
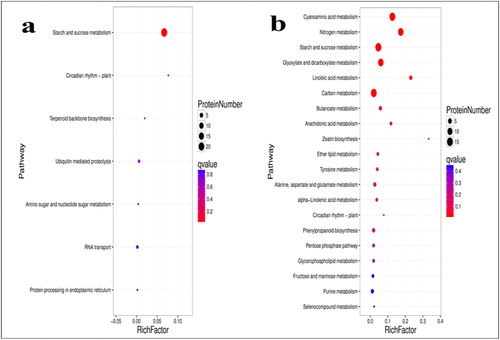
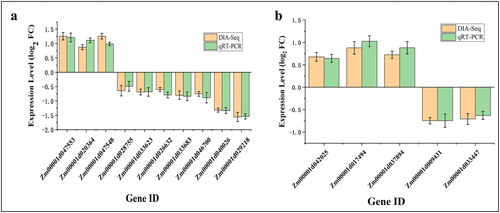
Figure 5. Confirmation of DIA-seq results by quantitative real-time PCR (qRT-PCR). Quantitative RT-PCR analysis of the expression patterns of the maize kernel genes encoded by differentially abundant proteins (DAPs) from different comparisons: DAPs specific to TD_TC (a) and SD_SC (b). Note: The y-axis represents qRT-PCR (green) relative expression levels (log2-fold change) and log2-fold change of the DIA-seq data (orange). Negative values of expression level mean that the genes were down-regulated in response to drought stress. Maize gene GAPDH (accession no. X07156) was used as the internal reference. Error bars represent the SE (n = 3).