
Figures & data
Table 1. Description of the 24 faecal samples from different herbivores, carnivores and omnivores used in this study.
Figure 1. Faecal bacterial community at the phylum (a) and genus (b) level. (a and b) Relative abundance of bacteria in the 24 faecal samples from different herbivores, carnivores and omnivores. Phyla or genera with abundance of less than 1% abundance were merged into ‘others’. The letters A to H followed by a number indicate the samples; A–C, herbivores; D–F, carnivores; G–H, omnivores (see ).
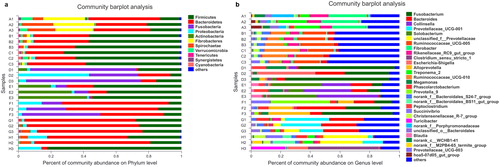
Figure 2. Statistical comparison of the relative abundance (a and b) and bacterial diversities (c and d) of gut microbiota among the three groups. (a) Comparison of dominant phyla in the A, B and C groups. (b) Comparison of dominant genera in the A, B and C groups. (c) Bacterial community richness (measured by ACE index) in the A, B and C groups. (d) Bacterial community diversity (measured by Sobs index) in the A, B and C groups. Differences were considered statistically significant at *p < 0.05; **p < 0.01; ***p < 0.001 level. Groups: A, herbivores; B, carnivores; C, omnivores.
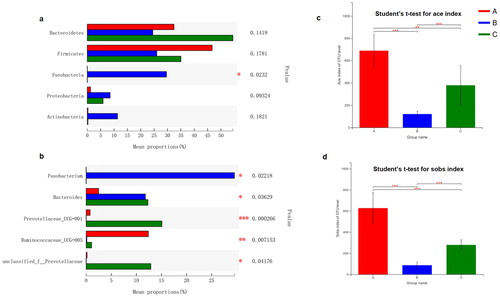
Figure 3. Relationship of the gut microbiota from different herbivores, carnivores and omnivores. (a) Clustering tree of the gut microbiotas in different animals from herbivores (A group), carnivores (B group) and omnivores (C group). Gut microbiota trees were generated using the UPGMA (unweighted pair group method with arithmetic mean) algorithm based on the Bray-Curtis distances generated by Mothur. (b) Principal coordinate analysis (PcoA) of community structure of the gut microbiotas of the three groups. Circular (red), triangular (blue) and diamond (green) shapes represent the gut microbiotas from herbivores (A group), carnivores (B group) and omnivores (C group), respectively. Distances between symbols on the ordination plot reflect relative dissimilarities in community structures. (c) Network-based analysis of faecal microbial communities in herbivores, carnivores and omnivores.
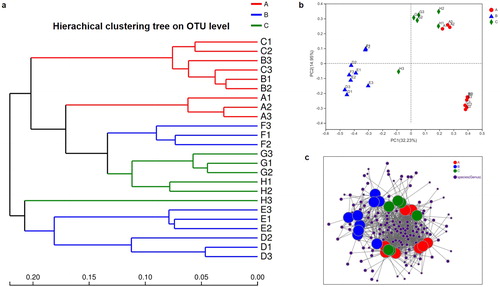
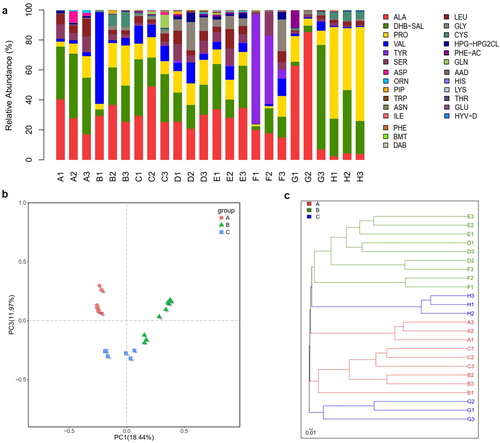
Figure 4. Richness and relationship of NRPS gene clusters in gut microbiome. (a) Relative abundance of predicted substrate of NRPS domains in the gut microbiome from different herbivores, carnivores and omnivores. (b) Principal coordinate analysis (PcoA) of community structure of the NRPS gene clusters in the three groups. Circular, triangular and square shapes represent the domains of NRPS in the gut microbiome from herbivores (A group), carnivores (B group) and omnivores (C group), respectively. Distances between symbols on the ordination plot reflect relative dissimilarities in community structures. (c) Bray-Curtis distances tree of the evolution of the NRPS gene domains in different herbivores (A group), carnivores (B group) and omnivores (C group).
Supplemental Material
Download PDF (1.3 MB)Data availability
The raw 16S rRNA sequences supporting the results of this study are available in the GenBank Database under the accession number PRJNA631813.