
Figures & data
Figure 1. Microstructures of Alternaria alternata (100×).
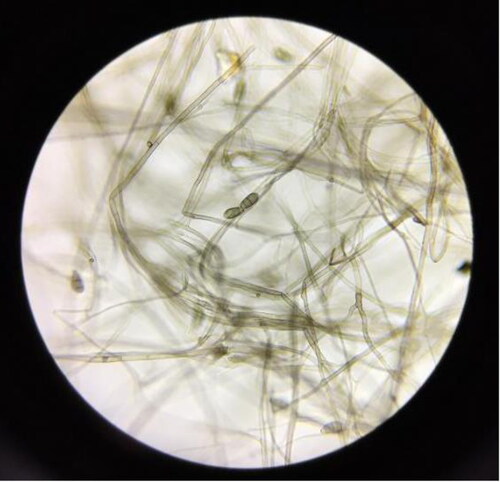
Table 1. Inhibition of Alternaria alternata by 10 endophytic bacteria derived from Ginkgo biloba.
Table 2. Physiological and biochemical indexes of Bacillus altitudinis Q7.
Figure 2. Identification of strain Bacillus altitudinis Q7 16S rDNA. (A) Agarose gel electrophoresis of PCR-amplified DNA of the strain. (B) Phylogenetic tree based on the sequence similarity of the 16S rRNA; Neighbour-joining tree based on analysis of partial 16S rRNA nucleotide sequences of the selected strain Q7. Numbers at branching points indicate the bootstrap values based on 1000 resampled datasets.
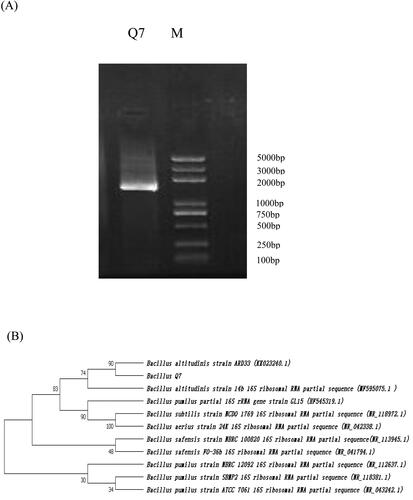
Figure 3. IR spectra of lipopeptide.
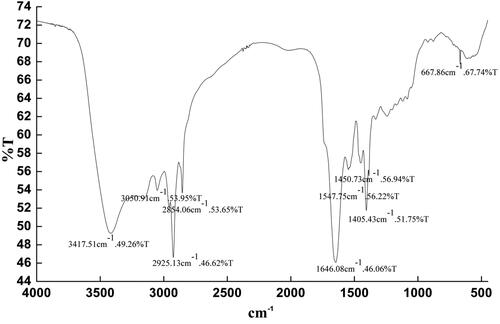
Figure 4. Effect of temperature (A) and pH (B) on the inhibitory activity of Bacillus sp Q7 fermentation broth against Alternaria alternata.
Note: Statistical analysis was performed using t test at P < 0.05. Each data point is representative of the mean of three replicates. The different letters (a–d) indicated the temperature and pH have significant differences at different times.
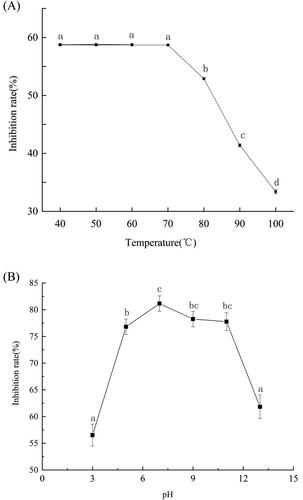
Figure 5. Contrast figure of Bacillus altitudinis Q7 fermentation broth extract effect on Alternaria alternata shape (1000×). The control group (A) vs. the group treated with Q7 (B).
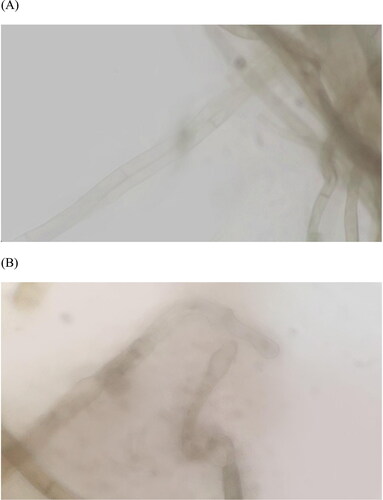
Figure 6. Analysis of the inhibitory effect of the Bacillus altitudinis Q7 fermentation broth on Alternaria alternata. Cell membrane permeability (A); Lipid peroxidation (B); SOD activity (C); POD activity (D); PPO activity (E). The control group (■); the group treated with Q7 (●).
Note: Statistical analysis was performed using t test at P < 0.05. Each data point is representative of the mean of three replicates. The different letters (a–f, A–E) indicated the significant differences at different times.
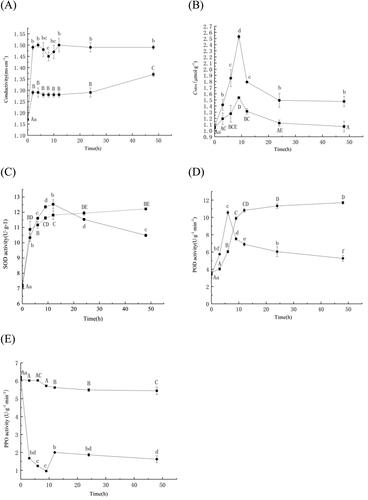
Figure 7. Analysis of the inhibitory effect of the Bacillus altitudinis Q7 lipopeptide on Alternaria alternata. Cell membrane permeability (A); Lipid peroxidation (B); SOD activity (C); POD activity (D); PPO activity (E). The control group (■); the group treated with lipopeptide (●). Statistical analysis was performed using t test at P < 0.05. Each data point is representative of the mean of three replicates.
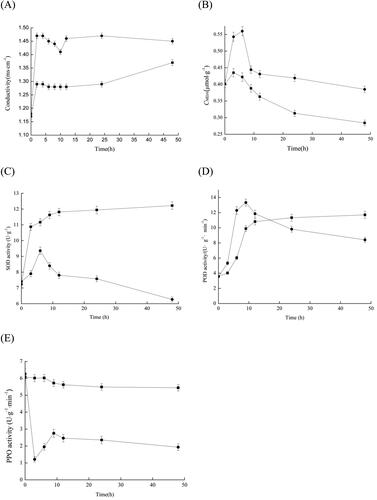
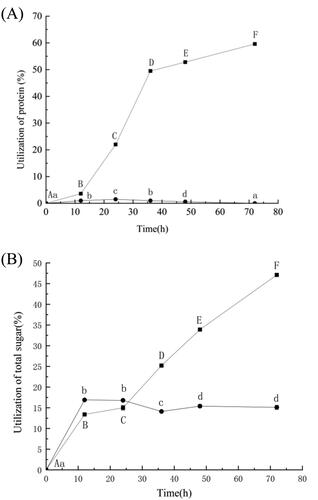
Figure 8. Effect of lipopeptides produced by Bacillus altitudinis Q7 on the utilization of nutrients in the culture medium by Alternaria alternata. Utilization of proteins (A); Utilization of total sugars (B). The control group (■); the group treated with lipopetide (●). Statistical analysis was performed using t test at P < 0.05. Each data point is representative of the mean of three replicates. The different letters (a–d, A–F) indicated the significant differences at different times.
Data availability statement
The raw data required to reproduce these findings cannot be shared at this time as the data also forms part of an ongoing study.