
Figures & data
Table 1. Association between mean RQ levels of PD-L1, STAT3, PTEN, EGFR, MINA53, mTOR and clinicopathological characteristics in patients with LUAD.
Table 2. Association between mean RQ levels of PD-L1, STAT3, PTEN, EGFR, MINA53, mTOR and clinicopathological characteristics in patients with LUSC.
Figure 1. mRNA expression levels. (A) Comparison between the levels of expression in LUAD (brick) and adjacent non-tumor tissues (turquoise) by RT-qPCR; (B) Comparison between the levels of expression in LUSC (brick) and adjacent non-tumor tissues (turquoise) by RT-qPCR; (C) Comparison between the levels of expression in LUAD (brick) and LUSC (turquoise).
Note: Criteria: Mann–Whitney U test was performed to evaluate the significance of expression level differences, p ≥ 0.05 consider as non-significant, *: p ≤ 0.05, **: p ≤ 0.01, ***: p ≤ 0.001, LUAD – lung adenocarcinoma, LUSC – lung squamous cell lung cancer
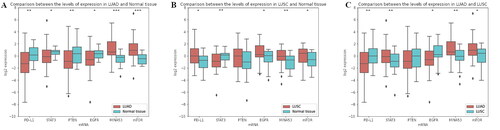
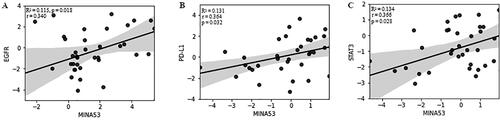
Figure 2. Linear regression and correlation analysis of the expression levels of (A) MINA53 and EGFR in LUAD samples; (B) MINA53 and PD-L1; (C) MINA53 and STAT3 in patients with LUSC.
Note: Criteria: Linear fit-line, 95% CI band and R2 are shown to illustrate the linear correlation between log2RQ values of both variables. The Pearson’s coefficient (r) and the p-value (p) are displayed.
Data availability statement
The data that support the findings of this study are available from the corresponding author, (VP), upon reasonable request.