
Figures & data
Figure 1. Chromosomal locations and duplications of genes associated with capsaicin synthesis on the Capsicum chinense chromosomes. Note: In the figure, the chromosome number is shown at the top of each bar. The gene clusters are indicated by black lines.
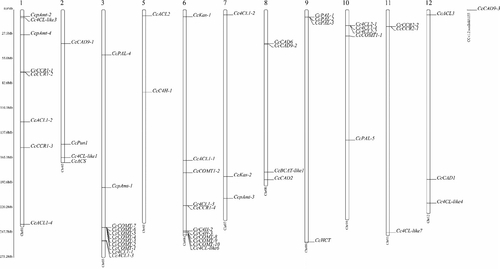
Figure 2. Structural analysis of the capsaicin metabolic genes: (A) NJ phylogenetic tree of capsaicin metabolic proteins; (B) Exon-intron structure of capsaicin metabolic genes. Note: In the figure, yellow indicates the exons; black indicates the introns.
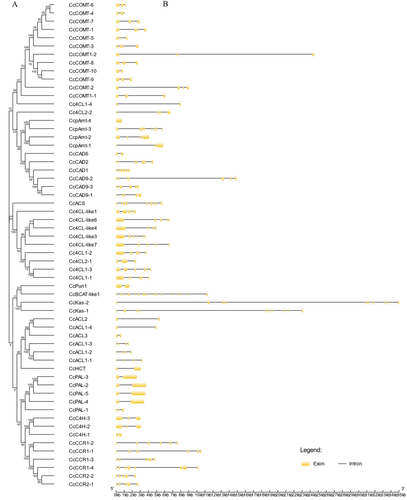
Table 1. Gene names and their corresponding GenBank numbers.
Table 2. Capsaicin metabolic genes in Capsicum chinense.
Figure 3. Promoter cis-regulatory element prediction of genes associated with capsaicin synthesis. Note: Different colors represent different cis elements.
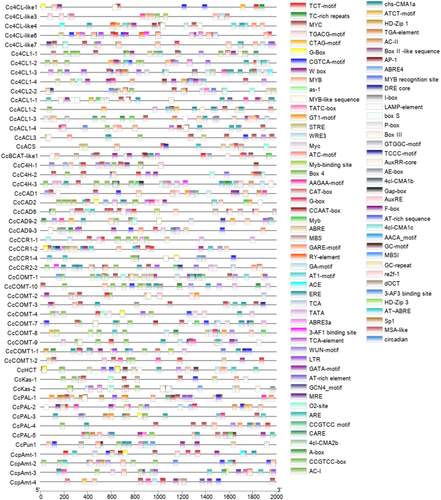
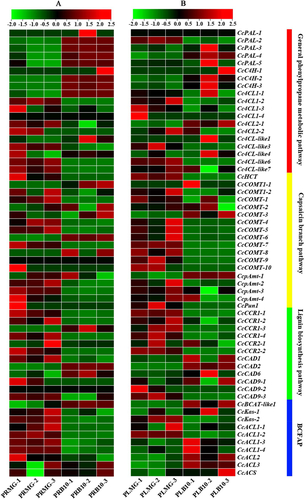
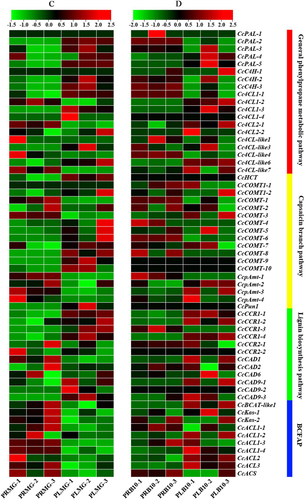
Figure 5. Expression heatmaps of the capsaicin metabolic genes in total fruits [Citation38] and placental tissue in Capsicum chinense L. [Citation12] during the fruit development stage based on the RNA-Seq data. Note: These data were normalized to a row scale. Days after pollination (DAP); Days post-anthesis (DPA); Fruit-Early (20DPA); Fruit-Breaker (30-45DPA); Fruit-Mature (45-60DPA).
![Figure 5. Expression heatmaps of the capsaicin metabolic genes in total fruits [Citation38] and placental tissue in Capsicum chinense L. [Citation12] during the fruit development stage based on the RNA-Seq data. Note: These data were normalized to a row scale. Days after pollination (DAP); Days post-anthesis (DPA); Fruit-Early (20DPA); Fruit-Breaker (30-45DPA); Fruit-Mature (45-60DPA).](/cms/asset/f1556299-1f1c-45d1-ae9e-10f737bebde3/tbeq_a_2071633_f0005_c.jpg)
Supplemental Material
Download PDF (372.2 KB)Data availability statement
The data that support the findings of this study are available from the corresponding author, [SHC], upon reasonable request.