
Figures & data
Figure 1. Workflow summary of the analysis approaches implemented in this study. TFBS, transcription factor binding sites; SNP, single-nucleotide polymorphisms.
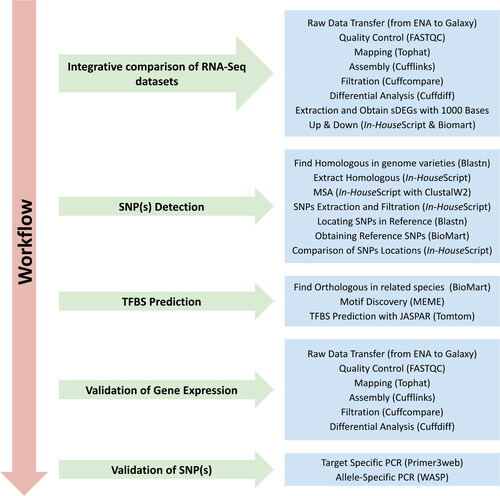
Figure 2. Venn diagram (A) illustrates the up-regulated DEGs determined between the TD1 and TD2, Venn diagram (B) illustrates the down-regulated DEGs determined between the TD1 and TD2; and (C) the expression levels of up- and down-regulated sDEGs in TD2 compared to TD1.
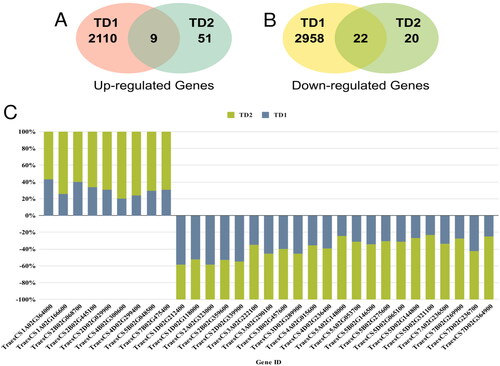
Table 1. Six SNPs identified within the 4 sDEGs and their allele, chromosomal position, gene name and description.
Figure 3. Discovered motifs and their p- and E-values as identified by MEME web server within the upstream regions of all MIOX-1 orthologous genes.
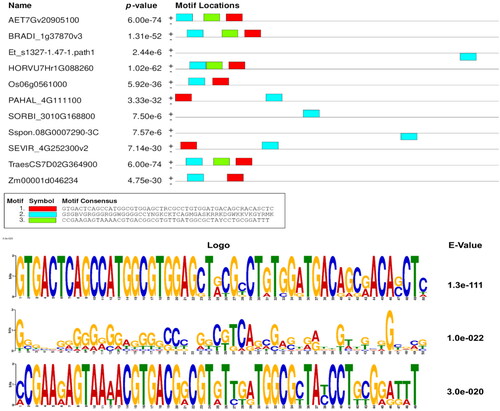
Figure 4. Motif comparison analysis shows the targeted SNP located at position five and its matching with the WRKY transcription factor 1 binding site.
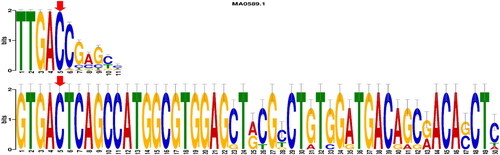
Figure 5. Heatmap represents the comparative expression levels results of the MIOX1 and WRKY1 genes between the QM6 cultivar (tolerant) and CS cultivar (sensitive) at four different timepoints.
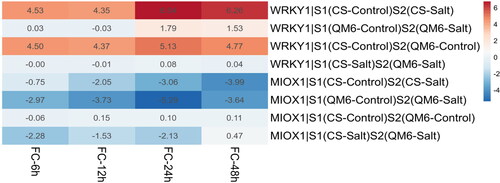
Figure 6. Allele-specific PCR gel electrophoresis results show that the homozygous allele (C/C) appeared only in Sakha-93 (the salt-tolerant cultivar), while a heterozygous allele (C/G) appeared only in Gemmeiza-9 (the salt-sensitive cultivar).
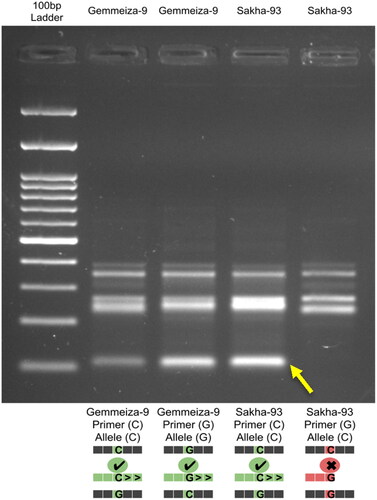
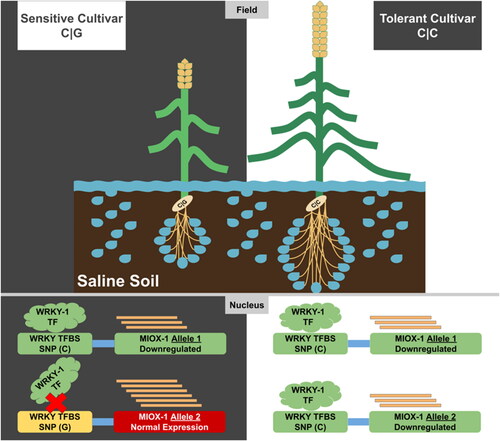
Figure 7. A graphical model illustrate the role of the MIOX1 and WRKY1 genes in presence/absence of the SNP (C/C) or (C/G) and its impact/role in explain the salinity-tolerance in wheat cultivars.
Supplemental Material
Download Zip (209.4 KB)Data availability statement
The authors agree to make data and materials supporting the results or analyses presented in their paper available upon reasonable request.