
Figures & data
Figure 1. Dicer promoted the generation of ROS. (A) Identification of Dicer expression in pCMV-control and pCMV-Dicer transfected SMMC-7721 cells. (B) The COX activity of pCMV-Dicer cells was repressed compared with those of blank control or pCMV-control cells, *p < .05. (C) The ROS level of pCMV-Dicer cells was increased compared with those of blank control or pCMV-control.**p < .01.
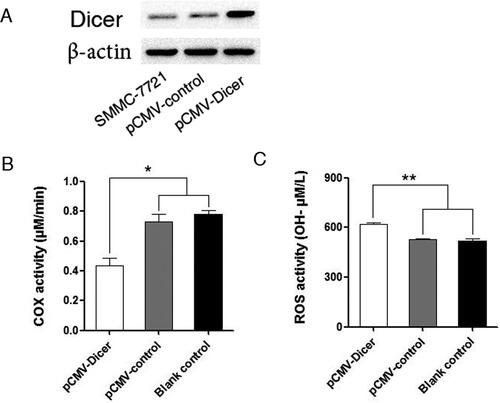
Table 1. The ROS levels were positively associated with Dicer expression at borderline statistical level by chi-test analysis in HCC tissue.
Figure 2. The influence of ADDA-5 hydrochloride or NAC treatment on COX activity and ROS production, respectively. (A) The COX activity of Dicer overexpressing cells was decreased after ADDA-5 hydrochloride intervention, **p < .01. (B) The ROS level of Dicer overexpressing cells was increased after ADDA-5 hydrochloride intervention, **p < .01. (C) The COX activity of Dicer overexpressing cells was decreased after NAC intervention, **p < .01. (D) The ROS level of Dicer overexpressing cells was decreased after NAC intervention, **p < .01.
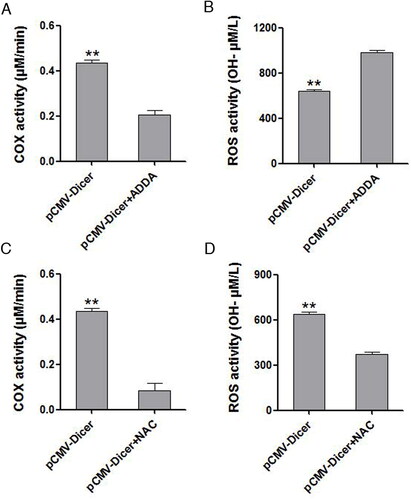
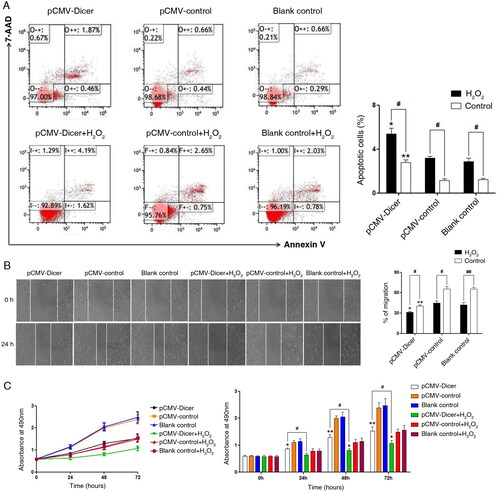
Figure 3. Elevated ROS level promoted cell apoptosis, inhibited cell proliferation and migration of HCC cells in all groups of pCMV-Dicer or pCMV-control transfected cells and blank control. (A) H2O2 treatment elevated the cell apoptotic rate. *p < .05, vs. pCMV-control transfected cells; #p < .05 vs. cells without H2O2 intervention. (B) H2O2 treatment suppressed cell migration. *p < .05, vs. pCMV-control transfected cells; #p < .05 vs. cells without H2O2 intervention. (C) H2O2 treatment suppressed cell viability. *p < .05, vs. pCMV-control transfected cells; #p < .05 vs. cells without H2O2 intervention.
Data availability statement
The data supporting the findings of this study are available from the corresponding author upon reasonable request.