
Figures & data
Table 1. Factor levels of PBD for screening of significant variables affecting succinic acid production and corresponding results.
Figure 1. The results of single-factor experiment. XML concentration (a), Nitrogen sources (b), CSLP concentration (c), MgCO3 concentration (d). XML: xylose mother liquor; CSLP: corn steep liquor powder; PM: peanut meal; SM: soybean meal, CM: cotton meal.
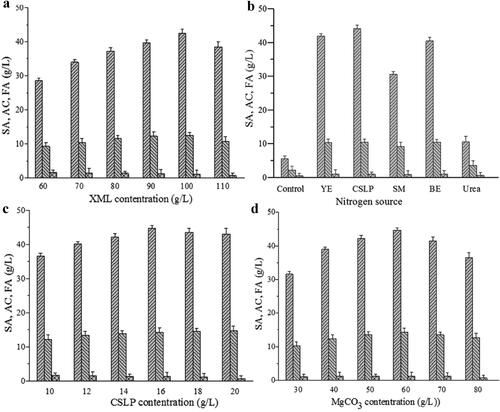
Table 2. The Box-Behnken design and the experimental responses of dependent variable Y (succinic acid concentration, g/L).
Table 3. Analysis of variance (ANOVA) and coefficient estimated for succinic acid.
Figure 2. Response surface curves of succinic acid production by A. succinogenes GXAS137 showing interaction between XML and CSLP (a), CSLP and MgCO3 (b), XML and MgCO3 (c). XML: xylose mother liquor; CSLP: corn steep liquor powder.
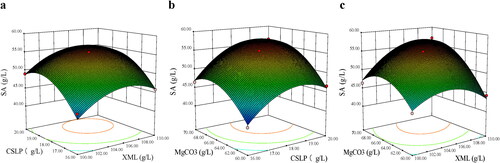
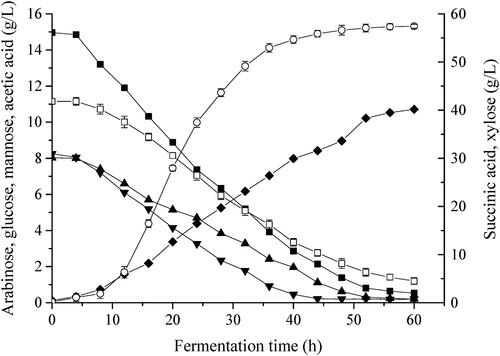
Figure 3. Time course of production of organic acids in batch fermentations with xylose mother liquor (XML). Cells were grown in a 1.3 L stirred bioreactor with a XML content of 110 g/L, corn steep liquor power (CSLP) of 18.86 g/L, and MgCO3 of 69.12 g/L. Symbols are arabinose (■), glucose (▲), mannose (▼), acetic acid (◆) xylose (△) and succinic acid (○).
Data availability statement
The data that support the findings of this study are available from the corresponding author, [HYZ], upon reasonable request.