
Figures & data
Figure 1. The internalization of fluorescently labeled myriocin in Fon is inhibited following treatment with the metabolic inhibitor NaN3 and incubation at 4 °C. Fluorescence intensity of cells that internalized TMR-Myriocin in untreated conidia (CK), conidia pre-treated with NaN3 and conidia pre-incubated at 4 °C. Fon conidia were pre-treated with 3 mM NaN3 or pre-incubated at 4 °C for 30 min before exposure to 1 MIC and 8MIC of rhodamine-labeled myriocin respectively. Images were captured after 3 h and 12 h of exposure to myriocin. Bar = 5 μm.
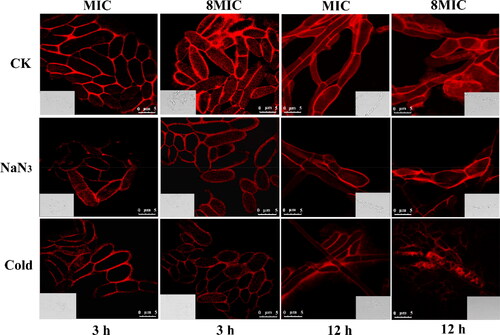
Figure 2. The effect of four endocytosis inhibitors on internalization of TMR-myriocin.
Note: Cells whose fluorescence intensity exceeds 50% of the cell area are regarded as a completely internalized cells.
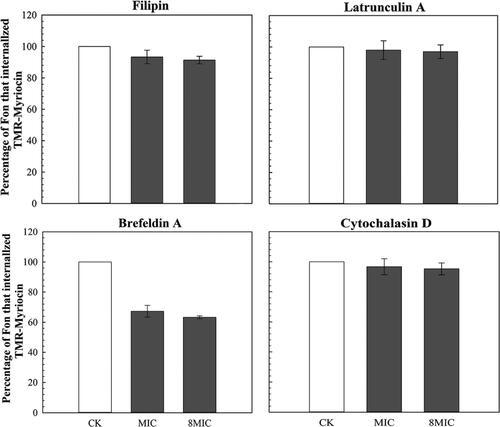
Figure 3. Venn diagram, number and GO functional annotations of the DEGs and DEPs (p < 0.05). CK, 0 μg/mL myriocin; MIC, 1.25 μg/mL myriocin; 8MIC, 10 μg/mL myriocin. (A) Venn diagram of the DEGs and DEPs in CK-VS-MIC and CK-VS-8MIC. This figure was performed by using Funrich 3.0. (B) The number of common DEGs or DEPs in both CK-VS-MIC and CK-VS-8MIC. (C) GO functional annotation of DEPs and DEGs. GO categories significantly enriched (P < 0.05) are shown in the figure. The ordinate represents the GO term, the lower abscissa represents the number of DEPs or DEGs (column) and the upper abscissa represents the per-cent (dot). The biological process, cellular component and molecular function are represented by red, green and blue, respectively.
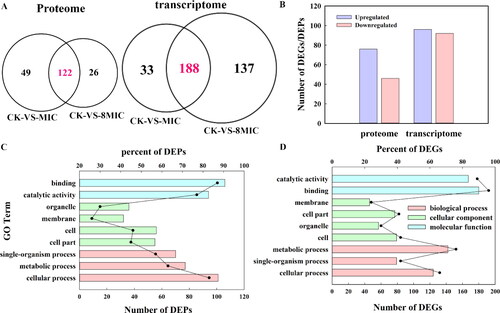
Figure 4. Go enrichment pathway, interaction networks, distribution of network center coefficient and clustering heatmap of DEPs.
(A) Go enrichment pathway of DEPs. The ordinate represents GO ID, the lower abscissa represents the number of DEPs (columns), and the upper abscissa represents the significance level (points) of enrichment.
(B) Diagram of interaction network among DEPs; each node represents a DEP, and the connection represents the correlation of DEP. The size of the node indicates the correlation with other DEPs. The bigger the node, the more important it is in the network.
(C) Distribution of the network center coefficient, abscissa represents protein ID, and ordinate represents centrality, including degree centrality, closeness centrality and betweenness centrality. The higher these three values are, the more important the node in maintaining the connection of the whole network, the larger the degree centrality of the node is, and the closer it is to the network center.
(D) Clustering heatmap of DEPs. The color represents the protein expression level, and the tree diagram of protein clustering is displayed on the left. The protein ID is displayed on the right.
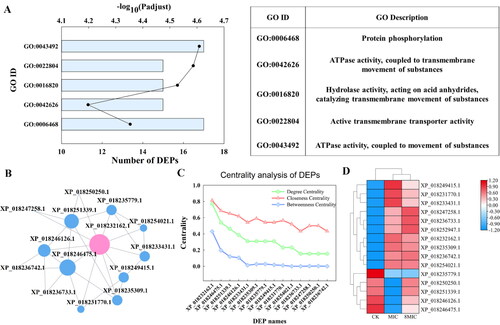
Figure 5. KEGG pathway enrichment, clustering heatmap of DEGs, and the number of upregulated and downregulated DEGs in the five pathways. (A) The KEGG pathway enrichment of DEGs. The ordinate represents the KEGG pathway, the nether abscissa represents the number of DEGs (columns), and the upper abscissa (dot) represents the significance level of enrichment. (B) Clustering heatmap of DEGs. The color shows the expression level of gene, and the tree diagram of gene clustering is displayed on the left. The gene ID is displayed on the right. (C) The number of upregulated and downregulated DEGs in the five pathways, which are cell cycle, meiosis, DNA replication, aminoacyl tRNA biosynthesis and ABC transporter.
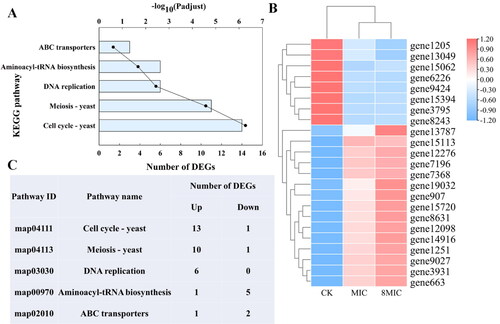
Figure 6. Functional annotation (A, B, C) of common DEGs. The functional descriptions of the COG types are shown in Supplemental Table S4. GO categories and KEGG pathways significantly enriched (p < 0.05) are shown in the figure.
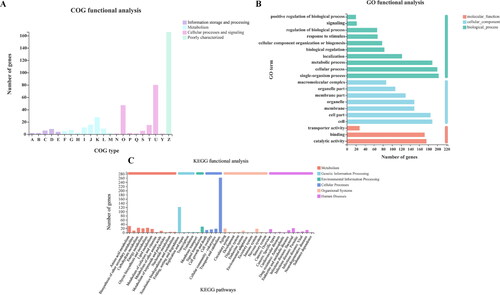
Figure 7. Enrichment analysis (A, B) of common DEGs. GO categories and KEGG pathways significantly enriched (p < 0.05) are shown in the figure.
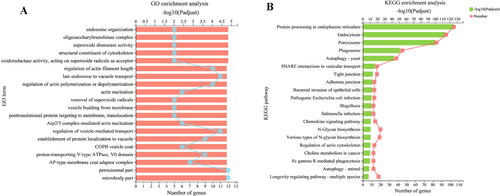
Figure 8. Heatmap (A,C) and network interaction analysis (B,D) of DEPs and DEGs related to endocytosis.
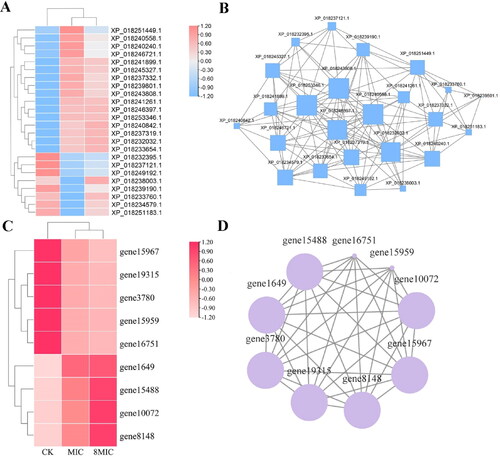
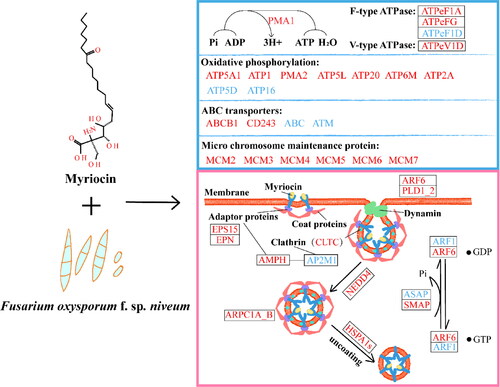
Figure 9. Conceptual model of myriocin entry into Fon cells. The expression of genes and proteins related to ATP and endocytosis at the mRNA and protein levels was affected. The blue box displays ATP related proteins and genes, mainly including those related to conversion of ADP to ATP, oxidative phosphorylation, ABC transporter and micro chromosome maintenance proteins. The pink box shows the expression of genes and proteins in the endocytosis pathway. Red and blue represent upregulated and downregulated genes and proteins, respectively. Ko names of DEPs and DEGs are listed in Supplemental Tables S7 and S8.
Supplemental Material
Download MS Word (82.2 KB)Data availability
The raw data of RNA-Seq and proteomics were deposited to NCBI (number PRJNA643229) and ProteomeX-change Consortium (PXD020176), respectively.