
Figures & data
Table 1. Real-time quantitative PCR primers.
Figure 1. Comparison of cytokinin content in the shoot apexes of pak choi at different developmental stages. DAV0, 0 days after transplanting; DAV10, 10 days after transplanting; S0, Stage immediately prior to flower bud differentiation; S1, flower bud differentiation stage 1.
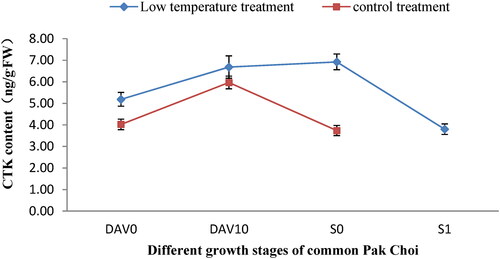
Table 2. Illumina DNA sequencing reads from nine libraries and mapping results.
Figure 2. Three-dimensional PCA of shoot apexes samples at different developmental periods.
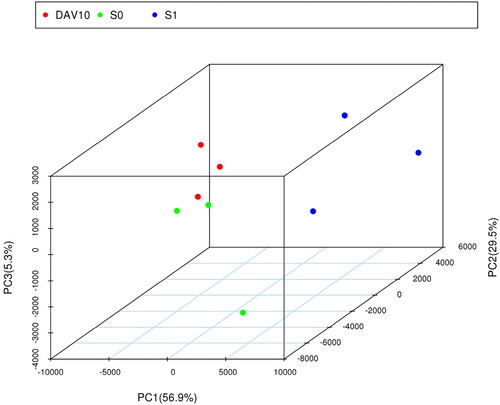
Figure 3. Comparison of RNA sequencing and RT-qPCR results.
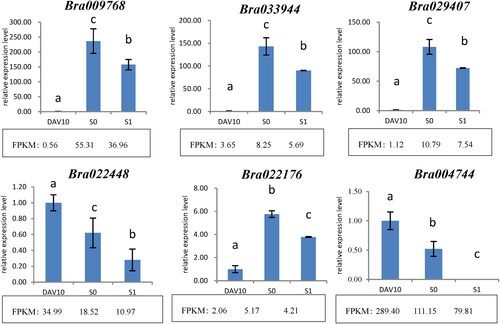
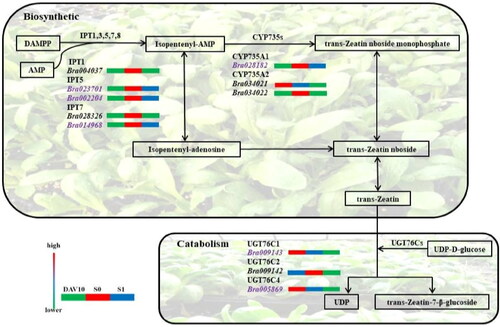
Figure 4. The trans-zeatin metabolic pathway.
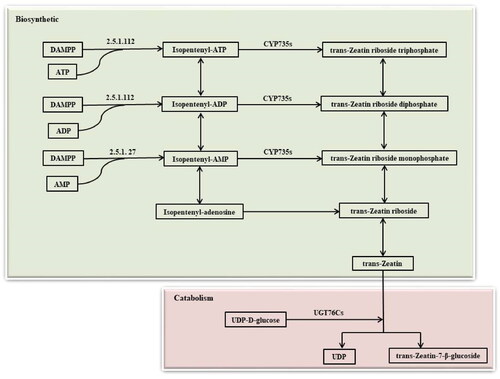
Table 3. Genes and enzymes related to cytokinin metabolism.
Table 4. Analysis of DEGs related to cytokinin metabolism in different developmental stages of pak choi.
Figure 5. Differentially expressed genes closely related to cytokinin metabolism at different developmental stages of pak choi. DAV10, 10 days after transplanting; S0, stage immediately prior to flower bud differentiation; S1, flower bud differentiation stage 1; green, blue and red indicate gene expression from low to high. Genes in purple font are closely related to cytokinin content.
Data availability
The datasets presented in this study can be found in online repositories. The names of the repository/repositories and accession number(s) can be found below: https://www.ncbi.nlm.nih.gov/sra/PRJNA821155