
Figures & data
Table 1. Primer sequences.
Figure 1. Comparison of the amino acid sequence of BrcSOC1 with 6 other SOC1 homologs.
Note: Species name and GenBank accession numbers for the sequences are as follows (in parentheses): BrSOC1 (Brassica rapa, XP009133734.1), BjSOC1 (Brassica juncea, AGB50999.1), BnSOC1 (Brassica napus, CDY53886.1), RsSOC1 (Raphanus sativus, XP018475674.1), SaSOC1 (Sinapis alba, AAB41526.1), AtSOC1 (Arabidopsis thaliana, NP182090.1). The dark blue color shows the same amino acid alignment, the light blue color shows more than two differences in amino acid sequence alignment, and the pink color shows one difference in amino acid sequence alignment
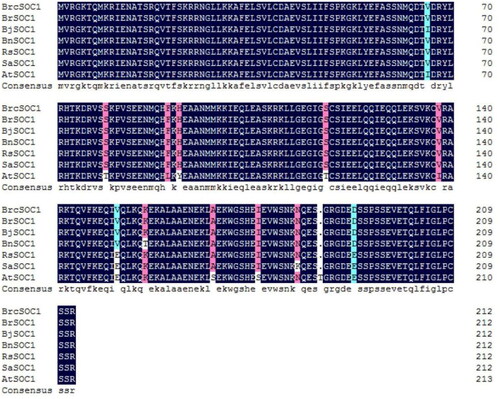
Figure 2. Phylogenetic tree of BrcSOC1 with 15 other SOC1 homologs.
Note: The scale bar (0.05) indicates a 5% change in amino acids. Numbers on each branch are bootstrap values
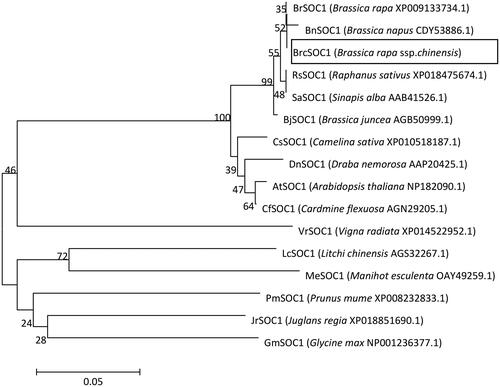
Figure 3. Subcellular localization of 35S:BrcSOC1-EGFP transiently expressed in N. benthamiana.
Note: The top four panels from left to right show GFP fluorescence, chloroplast (CHI) auto-fluorescence, bright-field image, and merged image of N. benthamiana epidermal cells expressing the empty vector. The bottom four panels from left to right show green fluorescent protein (GFP) fluorescence, chloroplast (CHI) auto-fluorescence, bright-field image, and merged image of N. benthamiana epidermal cells expressing the fusion protein observed using a confocal microscope.
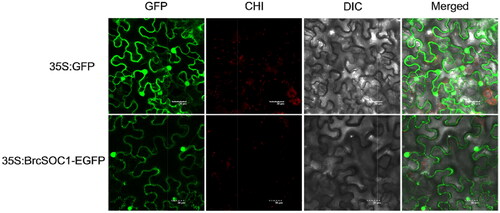
Figure 4. BrcSOC1 expression during different developmental stages (a) and in different tissues (b) in B.rapa line 75#.
Note: Mean values and SDs were obtained from three biological and three technical experiments with consistent results. Asterisks indicate significant differences among different stages and different tissue parts (**P < 0.01, Duncan’s test)
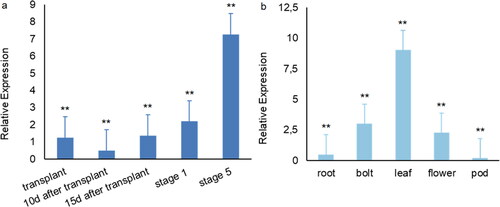
Figure 5. Growth of BrcSOC1 transgenic A. thaliana plants.
Note: The left picture shows T1 OE-BrcSOC1 generation transgenic plants. I, II, and III: Transgenic plants. IV and V: Wild-type Col. The right picture shows T2 OE-BrcSOC1 generation transgenic plants. VI: Transgenic plants. VII: Wild-type Col
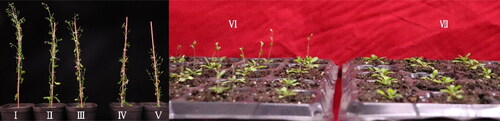
Figure 6. qRT-PCR verification of the expression of BrcSOC1 in wild-type Col and T2 OE-BrcSOC1 transgenic A. thaliana and the expression of AtSOC1 and SOC1 downstream genes in A. thaliana.
Note: CK: Col line, OE-1: T2 OE-BrcSOC1 line 1, OE-2: T2 OE-BrcSOC1 line 2. Mean values and SDs were obtained from three biological and three technical experiments with consistent results. Asterisks indicate significant differences in different genes and different lines (*P < 0.05, **P < 0.01, Duncan’s test).
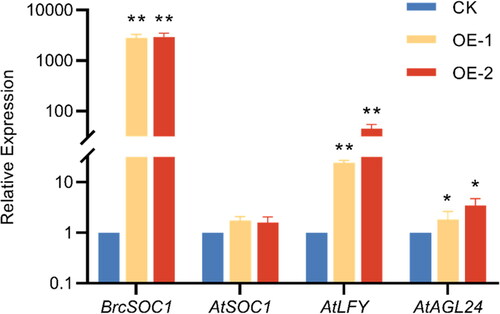
Table 2. Phenotypic statistics of T1 and T2 transgenic plants.
Data availability statement
All data that support the findings reported in this study are available from the corresponding author HLP upon reasonable request.