
Figures & data
Table 1. Characteristics of methanol, ethanol and sodium acetate as carbon sources.
Figure 1. Schematic overview of the experimental setup.
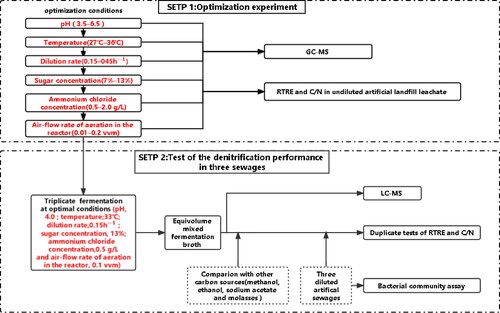
Figure 2. Flow chart of the continuous fermentation system. 1: Culture medium tank. 2: peristaltic pump; 3: fermenter; 4: collection tank; 5: thermometer; 6: air bath temperature control box; 7: air pump and 8: pH control. Notes: The fermenter was a 200 mL Erlenmeyer flask and was completely closed except for the intermittent aeration (30 min every 12h). The temperature and pH of the fermentation broth were automatically controlled.
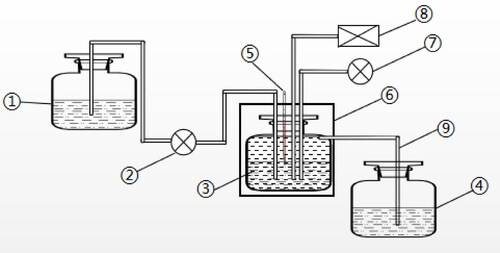
Table 2. Characteristics of three artificial diluted sewages.a
Figure 3. RTRE and C/N at different pH values (a); temperatures (b); dilution rates (c); sugar concentrations (d); ammonium chloride concentrations (e) and air-flow rates (f). Note: The fermentation parameters were stepwise optimized in the order of pH, temperature, dilution rate, sugar concentration, ammonium chloride concentration and aeration in the reactor. When pH was optimized, the other parameters were temperature, 30 °C; dilution rate, 0.25 h−1; sugar concentration, 10%; ammonium chloride concentration, 2 g/L and air-flow rate in the bioreactor, 0.2 vvm for 30 min every 12 h. When temperature was optimized, the other parameters were pH, 4.0; dilution rate, 0.25 h−1; sugar concentration, 10%; ammonium chloride concentration, 2 g/L and air-flow rate, 0.2 vvm for 30 min every 12 h. When the dilution rate was optimized, the other parameters were pH, 4.0; temperature, 33 °C; sugar concentration, 10%; ammonium chloride concentration, 2 g/L and air-flow rate, 0.2 vvm for 30 min every 12 h. When the sugar concentration was optimized, the other parameters were pH, 4.0; temperature, 33 °C; dilution rate, 0.15 h−1; ammonium chloride concentration, 2 g/L and air-flow rate, 0.2 vvm for 30 min every 12 h. When the ammonium chloride concentration was optimized, the other parameters were pH, 4.0; temperature, 33 °C; dilution rate, 0.15 h−1; sugar concentration, 13% and air-flow rate, 0.2 vvm for 30 min every 12 h. When the air-flow rate (aeration) was optimized, the other parameters were pH, 4.0; temperature, 33 °C; dilution rate, 0.15 h−1; sugar concentration, 13% and ammonium chloride concentration, 0.5 g/L. After 60 h of fermentation, the cell-free fermentation broths, as the carbon sources for denitrification, were collected to measure the RTRE and the C/N in the undiluted artificial landfill leachate. In the control treatment, the unfermented molasses were used as the carbon source for denitrification.
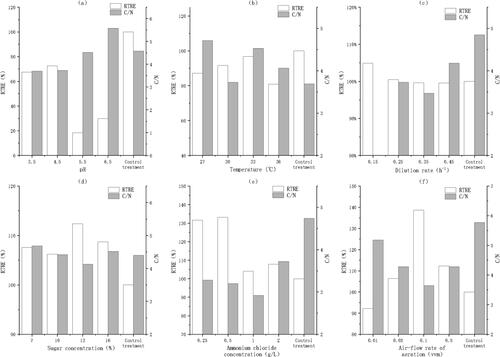
Figure 4. Maximum RTRE and relative content of ethanol in the optimization experiment. The optimal conditions were 33 °C, 0.15 h−1, 13%, 0.5 g/L and 0.1 vvm in the step to optimize temperature, dilution rate, sugar concentration, ammonium chloride concentration and air-flow rate, respectively.
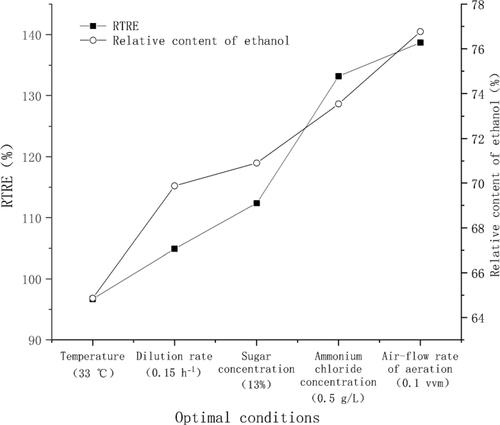
Figure 5. LC-MS results for the fermentation broth and unfermented medium.
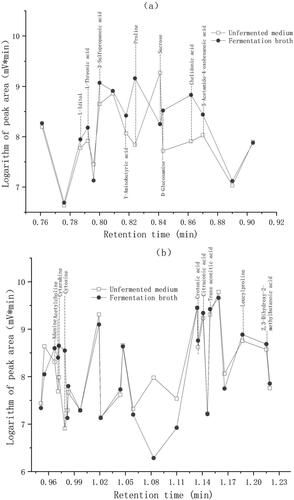
Figure 6. Kinetics of the total soluble solids content in triplicate fermentations.
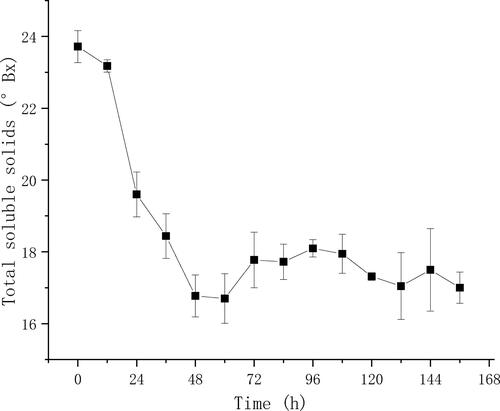
Figure 7. RTRE (a) and C/N (b) of five types of carbon source in three sewages.
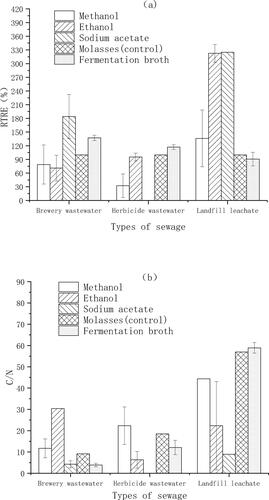
Figure 8. UPGMA (unweighted pair method with arithmetic mean) tree of three sewages.
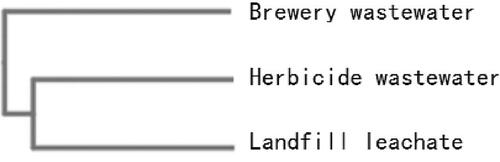
Figure 9. OTU abundance clustering heat maps of the three sewages at the genus level. The distribution of the top 50 genera (in abundance) was plotted for each sample, and the abundance values corresponding to different colours of each square were the relative abundance values of the genus.
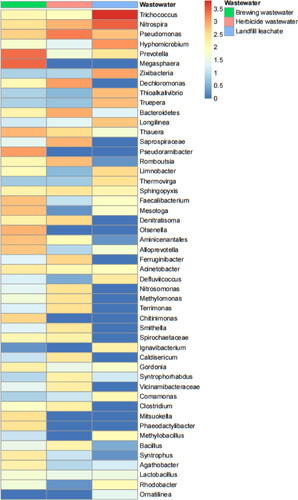
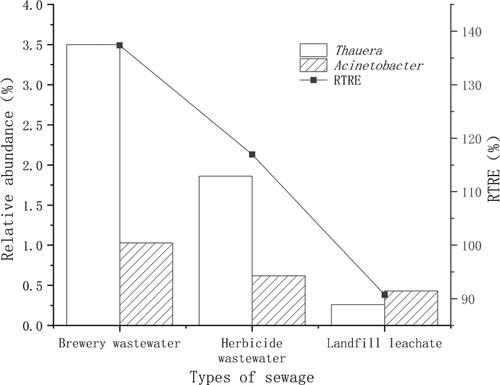
Figure 10. Relative abundance of Thauera and Acinetobacter in landfill leachate, herbicide wastewater and brewing wastewater and the RTRE when fermentation broth was used as the carbon source for denitrification.
Supplemental Material
Download Zip (46.6 KB)Data availability statement
The data that support the findings of this study (including the supplemental appendices) can be accessed at: https://data.mendeley.com/datasets/mp33mf9vz2