
Figures & data
Table 1. Allocation to geographic region of the ancient DNA samples analyzed.
Figure 1. Age distribution of all aDNA samples examined (100–15000 BP).
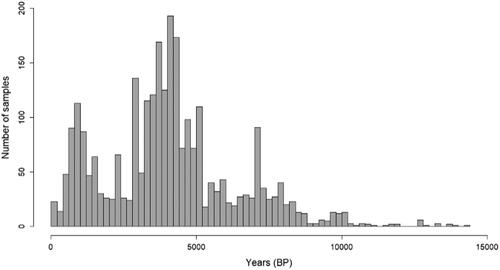
Figure 2. Estimated population frequencies of the 55 variants identified to be risk factors for oncologic diseases in ancient vs. contemporary populations. Points above the identity line (x = y) are variants estimated to have higher frequencies in contemporary compared to ancient populations. The three variants (rs28940298 in VHL, rs11571833 in BRCA2 and rs7837822 in TP53) are represented with black triangles.
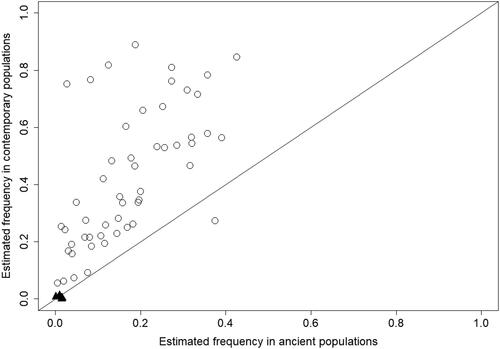
Figure 3. Temporal dynamics (1000–10000 BP) of the three examined variants established in ancient samples. The frequency trajectories are plotted using bins of 1000 years and sliding windows of 500 years. Uncertainty of the frequency estimation is indicated by a grey coloured area, representing the normal approximation of the 95% binomial proportion CI.
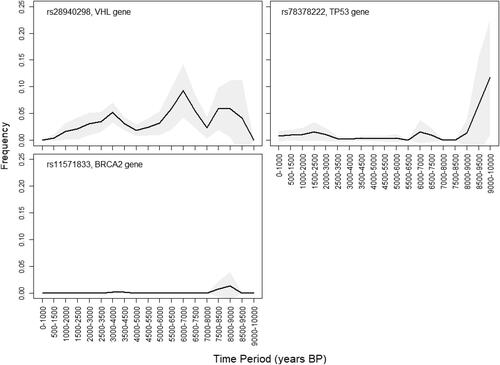
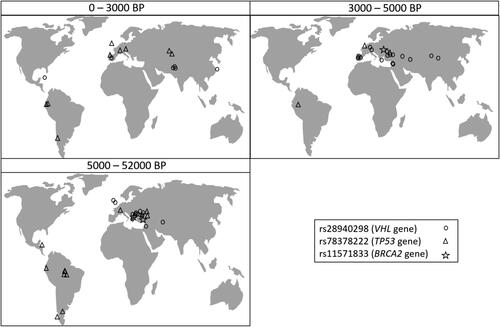
Figure 4. Geographical location of the aDNA samples in which the three variants were established. The samples are allocated in panels corresponding to the time period to which they have been dated (0–3000 BP, 3000–5000 BP, and 5000–52000 BP).
Supplemental Material
Download Zip (292.5 KB)Data availability
Genome-wide data used for this study are publicly available from Allen Ancient DNA Resource 2021, version 50.0, https://reich.hms.harvard.edu/allen-ancient-dna-resource-aadr-downloadable-genotypes-present-day-and-ancient-dna-data. Datasets used for the analyses are given in the Supplementary material S1 and S2. Any additional data used to support the findings of this study are available from the corresponding author upon request.