1,896
Views
1
CrossRef citations to date
0
Altmetric
Research Article

QTL for yield per plant under water deficit and well-watered conditions and drought susceptibility index in soybean (Glycine max (L.) Merr.)

, , , , , , , , , , , , & show all
Pages 92-103 | Received 03 Aug 2022, Accepted 02 Dec 2022, Published online: 30 Dec 2022

Figures & data

Table 1. Analysis of variance (ANOVA) of soybean seed yield per plant (YP) under drought stressed and full irrigation conditions for 149 soybean accessions.

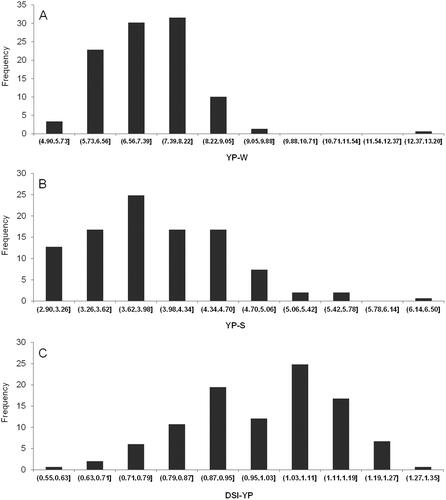
Table 2. Descriptive statistics of seed yield per plant (YP) under drought stressed and full irrigation conditions and DSI-YP values for 149 soybean cultivars.

Table 3. Phenotypic BLUP (best linear unbiased prediction) correlations between seed yield per plant (YP) under drought stressed and full irrigation conditions and DSI-YP in the 149 soybean cultivars.

Figure 1. Frequency distributions of YP-W (A), YP-S (B) and DSI (C) in the 149 soybean accessions.

Figure 1. Frequency distributions of YP-W (A), YP-S (B) and DSI (C) in the 149 soybean accessions.

Figure 2. Genetic structure and relatedness of the 149 soybean accessions. (A) Evolution of the natural logarithm probability of the data against K and the magnitude of Δk for each k value. (B) Clustering using k = 2 for the entire panel of soybean accessions. Each accession is represented by a vertical bar, partitioned into colored segments with the length of each segment representing the proportion of each individual genome contributed by either group when k = 2. (C) Unrooted neighbor-joining tree constructed using SNP data; soybean accessions from Heilongjiang are shown in red; from Jilin are shown in black; from Beijing are shown in purple; and from Japan are shown in blue. (D) Principal component analysis for the entire panel of soybean accessions.

Figure 2. Genetic structure and relatedness of the 149 soybean accessions. (A) Evolution of the natural logarithm probability of the data against K and the magnitude of Δk for each k value. (B) Clustering using k = 2 for the entire panel of soybean accessions. Each accession is represented by a vertical bar, partitioned into colored segments with the length of each segment representing the proportion of each individual genome contributed by either group when k = 2. (C) Unrooted neighbor-joining tree constructed using SNP data; soybean accessions from Heilongjiang are shown in red; from Jilin are shown in black; from Beijing are shown in purple; and from Japan are shown in blue. (D) Principal component analysis for the entire panel of soybean accessions.

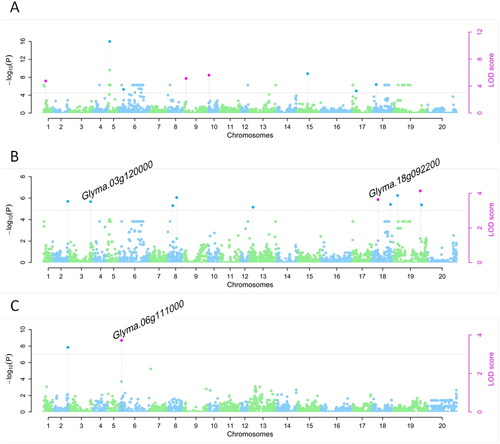
Table 4. SNPs significantly associated with YP under drought stressed and full irrigation conditions and DSI-YP.

Figure 3. Manhattan plots from the Q + K model across YP-W (A), YP-S (B) and DSI-YP (C). The names of candidate genes that are hit by significant SNPs are labeled on the top.

Figure 3. Manhattan plots from the Q + K model across YP-W (A), YP-S (B) and DSI-YP (C). The names of candidate genes that are hit by significant SNPs are labeled on the top.
Supplemental material

Supplemental Material

Download Zip (679.6 KB)

Data availability statement

The data that support the findings of this study are available from the corresponding author, [LJQ], upon reasonable request.