
Figures & data
Figure 1. Analysis of phylogenetic relationships of BBX genes between Arabidopsis and soybean. MEGA-X was used to align BBX proteins and construct a neighbor-joining (NJ) phylogenetic tree [Citation48]; bootstrapping was conducted using 1000 replications.
![Figure 1. Analysis of phylogenetic relationships of BBX genes between Arabidopsis and soybean. MEGA-X was used to align BBX proteins and construct a neighbor-joining (NJ) phylogenetic tree [Citation48]; bootstrapping was conducted using 1000 replications.](/cms/asset/df182f2a-4797-4e30-9357-532ad489c7ee/tbeq_a_2155570_f0001_c.jpg)
Figure 2. GmBBX gene structures and conserved protein motifs. Analysis of phylogenetic relationships of soybean BBX genes (A). Gene structure of GmBBX (B). Conserved motif analysis of GmBBX genes (C). Tbtools [Citation49] was used for visualization.
![Figure 2. GmBBX gene structures and conserved protein motifs. Analysis of phylogenetic relationships of soybean BBX genes (A). Gene structure of GmBBX (B). Conserved motif analysis of GmBBX genes (C). Tbtools [Citation49] was used for visualization.](/cms/asset/b52cd716-80fc-49a6-92ad-5585ec851e82/tbeq_a_2155570_f0002_c.jpg)
Figure 3. Chromosomal distribution of soybean BBX genes. Chromosomal mapping was based on the physical position in 20 soybean chromosomes. The scale on the left is in megabases (Mb).
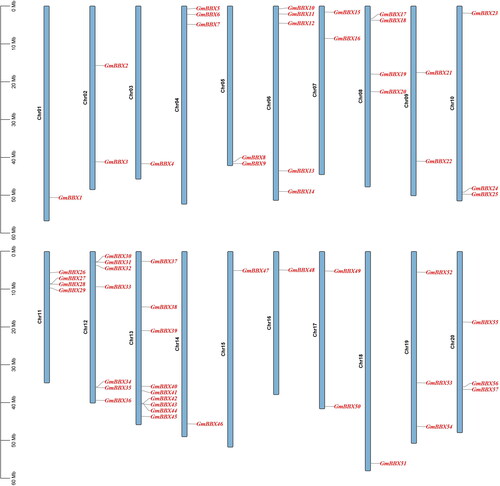
Figure 4. Analysis of collinearity of the BBX gene family between Arabidopsis thaliana, Brassica rapa, Brachypodium distachyon, Oryza sativa and Glycine max. The segmental duplicated genes are indicated in red and connected by lines. Orange pillar and Green pillar represent chromosome.
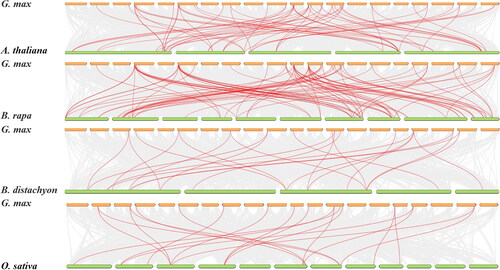
Figure 5. Heatmap of putative cis-elements present at GmBBX gene promoter regions. The 22 elements contained in the BBX gene family include zein metabolism regulation, wound responsive, seed-specific regulation, salicylic acid responsive, MYBHv1 binding site, meristem expression, MeJA responsive, flavonoid biosynthetic, endosperm-specific negative expression, endosperm expression, defense and stress responsive, circadian control, cell cycle regulation, auxin responsive, gibberellin responsive, AT-rich DNA binding domain, light responsive, anoxic-specific inducibility, anerobic induction, low temperature responsive, abscisic acid responsive and 60 K protein binding site. The number of cis-acting elements present in the promoter are represented by different values.
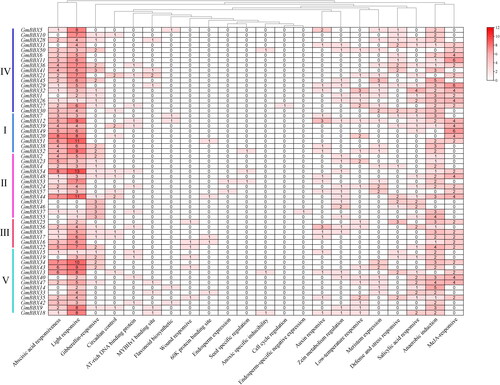
Figure 6. Heatmap of soybean GmBBX gene expression levels in seven tissues. AM, W82 apical meristem 14 days after germination; Flower, R2 flower; Leaf, leaves 18 days after germination; Pod, R6 pods; Root tip, root apex three days after germination; and Root, roots 18 days after germination.
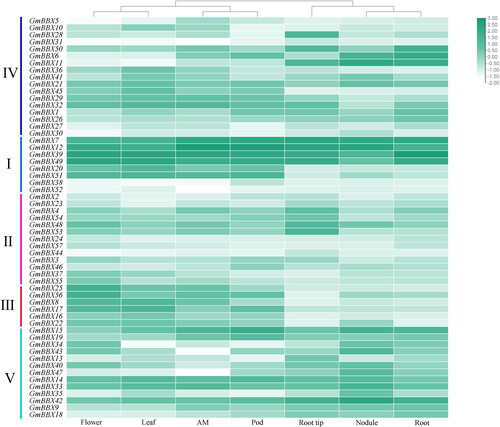
Figure 7. qRT-PCR gene expression analysis of 10 GmBBX genes in abiotically stressed soybean plants: high salt stress treatment (A); osmotic stress treatment (B); high temperature stress treatment (C); cold temperature stress treatment (D). Different letters indicate significant differences at the p < 0.05 level. All experiments consisted of three biological replicates. GmACTIN and GmTubulin were used as reference genes.
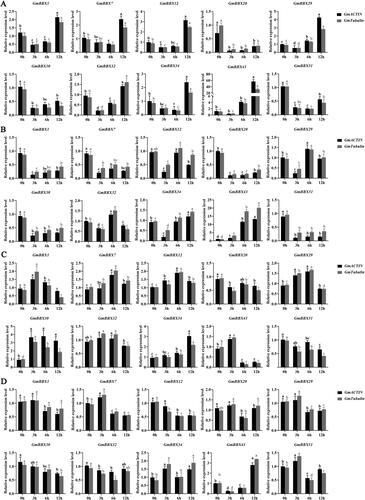
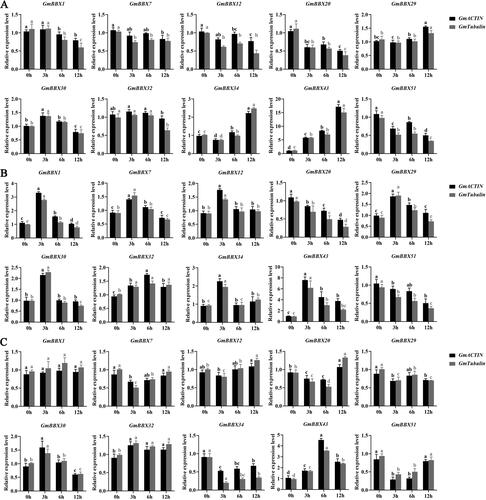
Figure 8. qRT-PCR gene expression analysis of 10 GmBBX genes in phytohormone-treated soybean plants. ABA treatment (A). SA treatment (B). MeJA treatment (C). Different letters indicate significant differences at the p < 0.05 level. All experiments consisted of three biological replicates. The black column indicates the expression level of GmACTIN as an internal reference gene. The grey column indicates the expression level of GmTubulin as an internal reference gene.
Supplemental Material
Download Zip (49.6 KB)Data availability statement
The data that support the findings reported in this study are available from the corresponding author (GSJ) on reasonable request.