
Figures & data
Figure 1. Fully expanded leaves of P. depressa (1), P. danxiaensis (2), the F1 hybrid (3) and some individuals of the F2 population (4–8).
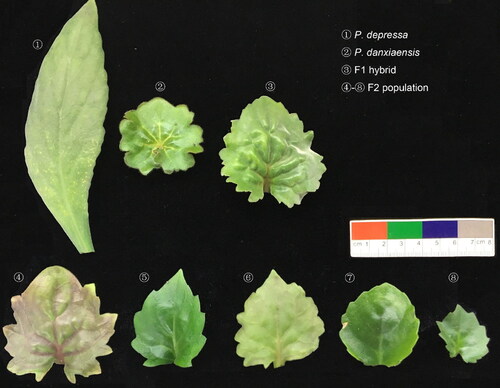
Table 1. Means and standard deviations for the four studied traits in P. depressa and P. danxiaensis and F1 hybrids, and phenotypic values range of F2 population.
Figure 2. Histograms of the four analyzed traits in the F2 population. Phenotypic means for P. depressa, P. danxiaensis and F1 hybrids are indicated with blue, red and orange arrows, respectively.
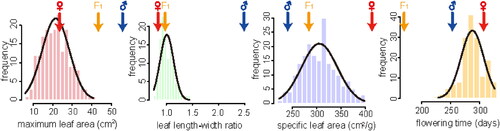
Figure 3. Correlations between and within the four traits (LA: maximum leaf area; LWR: leaf length-width ratio; SLA: specific leaf area; FT: flowering time) in the F2 population. Scatterplots of all traits are given below the diagonal and Spearman’s correlation coefficients and associated significance are given above the diagonal.
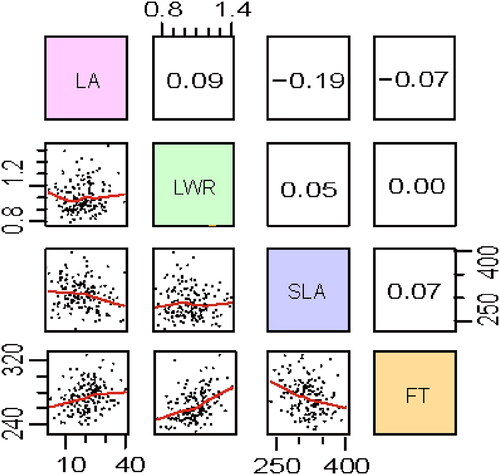
Figure 4. Genome location of significant QTLs for four traits. Confidence intervals of the QTLs are illustrated on the right side of the linkage groups.
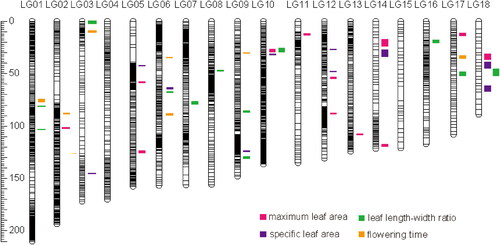
Figure 5. The phenotypic variance explained value of QTLs for four traits. LA: maximum leaf area; LWR: leaf length-width ratio; SLA: specific leaf area; FT: flowering time.
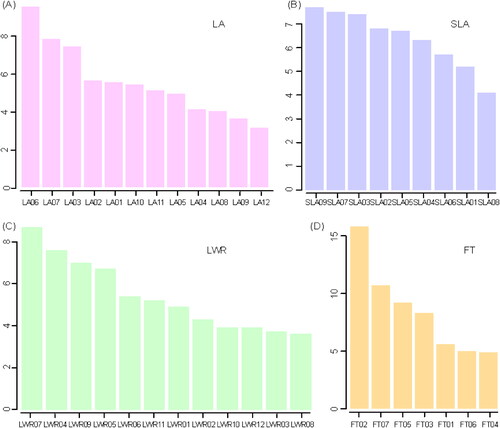
Table 2. Summary of significant epistatic interaction between QTLs.
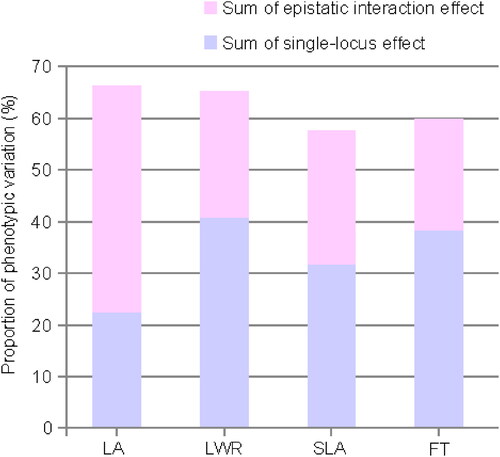
Figure 6. Proportion of phenotypic variation explained by all of the single QTLs and epistatic interactions. LA: maximum leaf area; LWR: leaf length-width ratio; SLA: specific leaf area; FT: flowering time.
Data availability statement
All the data and plant material are available from the first author (CF) upon reasonable request. Traits data for analysis are available at the FIGSHARE repository: Feng C, Feng C, Yang L, Kang M, Rausher M. qtlST script and phenotypic data. figshare. Dataset; 2019. https://doi.org/10.6084/m9.figshare.7270715.v3