
Figures & data
Table 1. Experimental variables at two levels used for the antifungal effect of the cell-free filtrates from HU2014 culture using PB design.
Table 2. PB design for the optimisation of parameters influencing antifungal activity of the cell-free filtrates from HU2014 culture.
Table 3. Input factors with their ranges and levels.
Table 4. RSM-based FCCD experimental design matrix for three factors.
Figure 1. Scanning broad spectrum of the cell-free filtrates of HU2014 culture broth by spectrophotometer. IA1-10 represent the Abs lines of different sampling times.
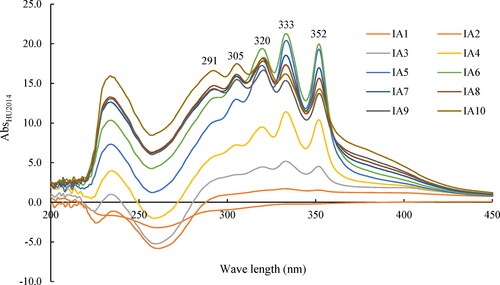
Figure 2. Scanning broad spectrum of four fractions extracted from the cell-free filtrates of HU2014 culture broth by spectrophotometry (A) and the antifungal activity of four fractions against R. solani YL-3 on day 3 (B). Values are means ± SD of three independent experiments. Means with the same letter for inhibition rate are not significantly different (p<0.05). F2, F4, F6 and F8 represent one of fractions, respectively.
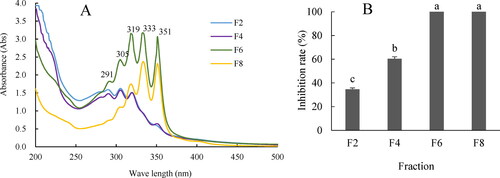
Figure 3. Antifungal activities of cell-free filtrates of HU2014 culture broth against R. solani YL-3 and biomass growth of HU2014 in different conditions: Different basal media (A) and different culture conditions (B-F). Each treatment was repeated three times with three biological replicates, and the data show Means ± SD. G1 represents Gause’s No.1 medium. Cza represents Czapek’s medium.
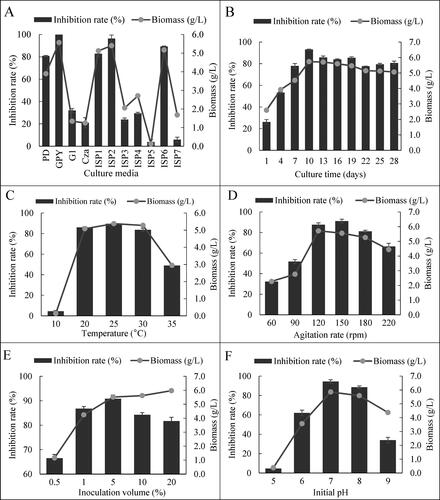
Figure 4. The antifungal activities of cell-free filtrates of HU2014 culture broth with different medium components against R. solani YL-3 and the biomass of the strain (ACE), and variation of the R. solani YL-3 (BDF) inhibition rate with different concentration of medium components.
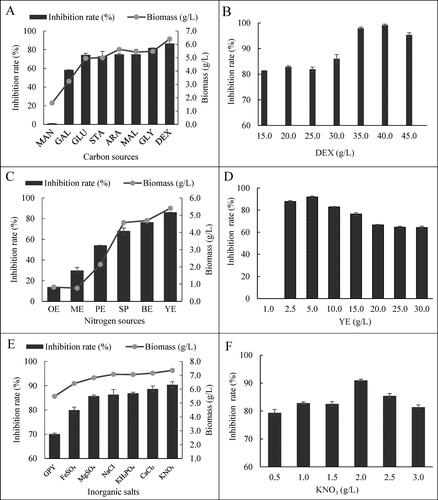
Figure 5. Pareto chart of the standardised effects for eight medium factors on the antifungal activities of the cell-free filtrates of HU2014 culture broth.
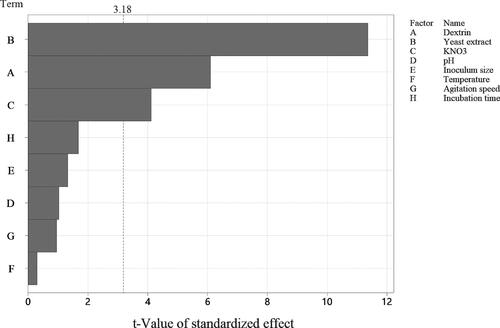
Table 5. ANOVA for the experimental result of PB design.
Table 6. ANOVA for Quadratic RSM model details.
Figure 6. 3D surface plot for the inhibition rate. (A) Nitrogen source and Carbon source; (B) Nitrogen source and inorganic salt; (C) Carbon source and inorganic salt. (D) Actual vs. predicted values plot for the inhibition rate. Abbreviation: DEX represents dextrin, YE represents yeast extract.
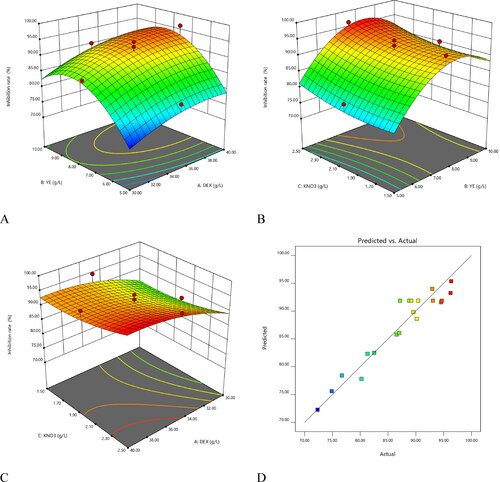
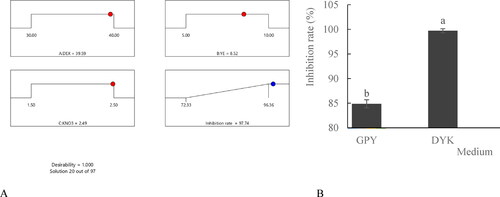
Figure 7. Optimisation result for the inhibition rate using RSM (A) and the inhibition rate of the cell-free filtrates of HU2014 cultured in GPY and DYK to R. solani YL-3 (B). DEX represents dextrin, YE represents yeast extract; DYK represents the optimised medium (dextrin, yeast extract and KNO3).
Supplemental Material
Download PDF (686.4 KB)Data availability statement
The data supporting the findings of this study are available from the authors upon reasonable request.