
Figures & data
Table 1. Number of reads sequenced and mapped to soybean genome.
Figure 1. Soybean seedlings under B-deficiency (without 0.045 mmol L−1 H3BO3) and B-sufficiency (with 0.045 mmol L−1 H3BO3) conditions. The seedlings were cultivated for 12 h, 24 h, 72 h and 8 days in hydroponic culture systems.
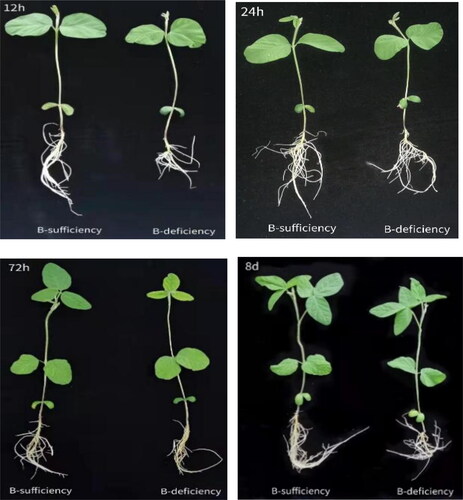
Figure 2. Physiological responses of soybean seedlings to B deficiency. (a) Plant height of soybean (cm). (b) SPAD values. (c) The Fv/Fm values of chlorophyll fluorescence. Different letters indicate significant differences at p < 0.05 according to Duncan’s multiple comparison tests.
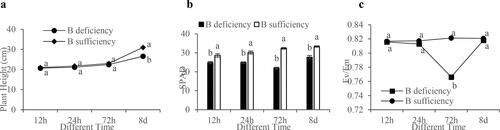
Figure 3. DEGs in soybean under B deficiency. (a) Number of DEGs at each time point. (b) Venn diagram showing the distribution of DEGs at each time point (p value <0.05). CK, control; T, B deficiency treatment; numbers 1–4 represent the four sampling time points, 12 h, 24 h, 72 h and 8 days, respectively.
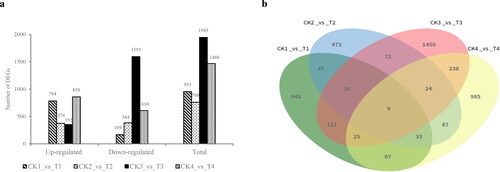
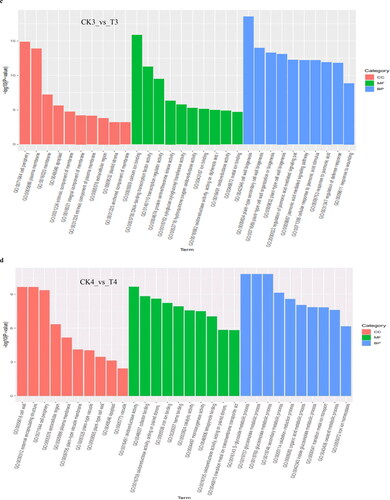
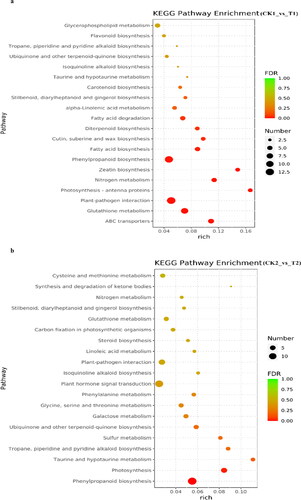
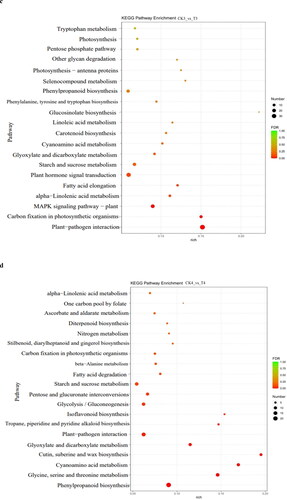
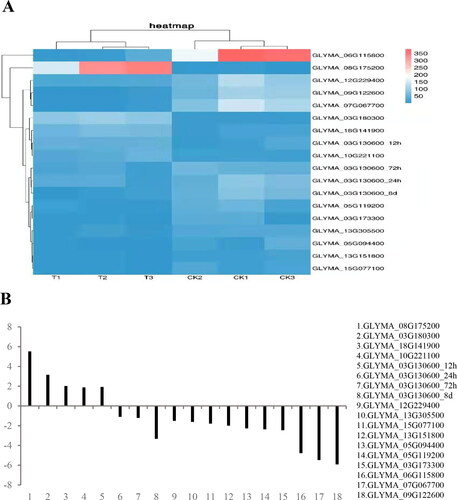
Figure 6. ( A) Performance of FPKM values of 15 DEGs determined from the RNA-seq; (B) Expression of 18 DEGs in qRT-PCR.
Supplemental Material
Download MS Word (30.9 KB)Data availability statement
The data that support the findings of this study are available from the corresponding authors, Li, Q., Su, E. H. and Fan, L., upon reasonable request.