
Figures & data
Figure 1. Ethiopia map showing sample collection sites, DMS coordinate system.
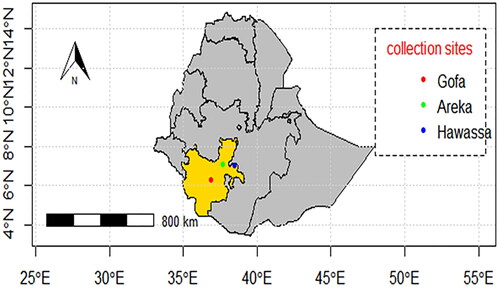
Figure 2. Pure cultures of Colletotrichum lindemuthianum growing on PDA media.
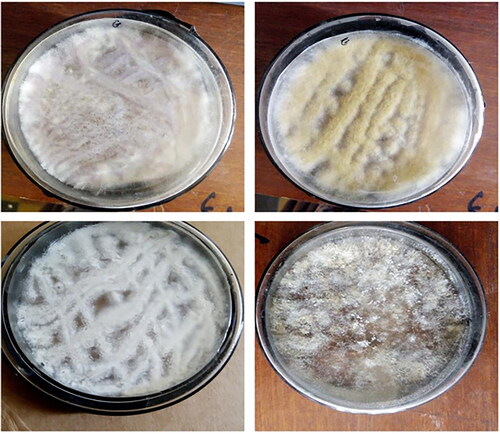
Table 1. Standard differential cultivars used to characterize Colletotrichum lindemuthianum, their binary Codes, resistance genes and gene pool.
Table 2. Race designation, number of isolates and susceptible (S) and resistant (R) reactions of common bean differential cultivars to 31 virulence races of Colletotrichum lindemuthianum identified from 40 isolates collected from Southern common bean growing area.
Figure 3. Frequency of resistance reaction of 12 differential common bean cultivars using 40 Colletotrichum lindemuthianum isolates collected from southern Ethiopia.
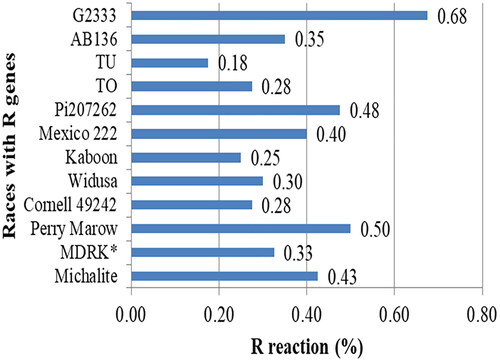
Figure 4. Banding patterns of some Colletotrichum lindemuthianum isolates collected from common bean genotypes and generated by rep-PCR. Lane M is 100 bp DNA molecular size marker (Cleaver Scientific DNA Marker CSL-MDNA-100BP for Gel Electrophoresis 100–1500 bp, https://www.reagecon.com/en-gb/cleaver-scientific-dna-marker-csl-mdna-100bp-for-6256961); Lanes 1–20 represent of C. lindemuthianum isolates etar-041, eta-002, etar-043, etar-049, etar-045, eta-001, etar-042, etar-044, eta-083, eta-009, eta-007, eta-081, eta-003, eta-006, etg-068, etar-047, eta-010, etg-066, etar-046 and eta-080, respectively.
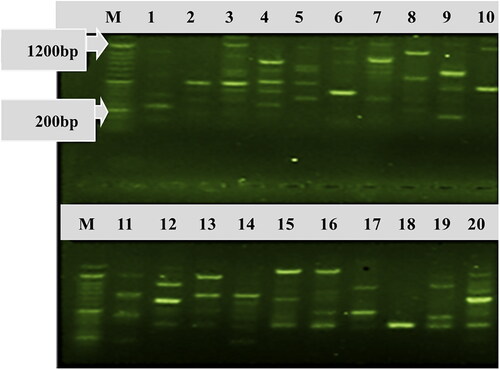
Table 3. Genetic diversity parameters indicating the presence of genetic diversity among three Colletotrichum lindemuthianum populations.
Table 4. Analysis of variance (AMOVA) of 40 Colletotrichum lindemuthianum isolates collected from three sites of Southern Ethiopia, indicating genetic variation within and among the isolates.
Figure 5. A two-dimensional plot of the Principal Coordinate Analysis (PCoA) of Colletotrichum lindemuthianum isolates from common bean based on rep-PCR data based on populations. Pop1, Pop2 and Pop3 indicate the isolates collected from Hawassa, Areka and Gofa, respectively.
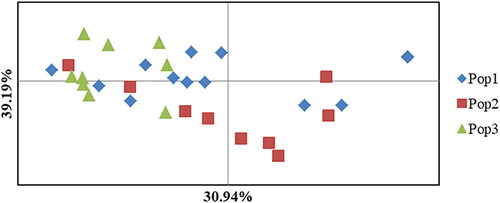
Figure 6. Neighbor-Joining (NJ) tree showing genetic relationships among 40 Colletotrichum lindemuthianum isolates from common bean genotypes. The genogram was generated based on neighbor-joining algorithms [Citation28] by MEGA 6 [Citation29].
![Figure 6. Neighbor-Joining (NJ) tree showing genetic relationships among 40 Colletotrichum lindemuthianum isolates from common bean genotypes. The genogram was generated based on neighbor-joining algorithms [Citation28] by MEGA 6 [Citation29].](/cms/asset/67cbb9fb-1f21-4ada-9b8e-d54a5e9f2301/tbeq_a_2206493_f0006_c.jpg)
Data availability statement
All data that support the findings reported in this study are available from the corresponding author [EW] upon reasonable request.